1. Market Snapshot: This Week at a Glance
Welcome back to Advisor Insights, brought to you by The Motley Fool! This week the market handed advisors a trifecta of client-call material: Election Day, an AI-driven selloff that pushed the Nasdaq into correction territory, and a Fed that held in October but left the door to a December hike wide open.
Stocks rallied Wednesday after the midterms, then gave it all back and more on Thursday as chip stocks plunged on fears of tougher AI regulation and a slower data-center buildout. The S&P 500 fell nearly 4.4%, its worst day since April 2025 and about 6% below its October record close, while the Dow lost 3.4%. The VIX jumped to 26.7, and the 10-year Treasury slipped to about 4.84%.
Inside: how to talk about midterms without letting the ballot box steer a portfolio and what a record-setting ETF launch year means for your due diligence. Also, two planning conversations worth having now: spotting early financial warning signs of cognitive decline, and rescuing small 401(k) balances left behind at old employers.
Market Snapshot:
- Equities: Stocks plummeted Thursday, with the Nasdaq Composite falling 5.5% and entering correction territory, while the S&P 500 dropped 4.4%, and the Dow lost 3.4%. The Russell 2000 fell 4.5% and also entered a correction, while the iShares Semiconductor ETF (SOXX) dropped more than 10%, its worst day since March 2020.
- Global markets: The AI-chip selloff hit Asia hardest. South Korea’s KOSPI fell 5.3%, Taiwan’s Taiex 3.2%, and Japan’s Nikkei 225 1.8%. Hong Kong’s Hang Seng bucked the trend (+3.7%), and Europe’s STOXX 600 rose about 0.7% in morning trading, near a record high.
- Rates: 10-year Treasury near 4.84% at Thursday’s close as investors sought safety, down from about 5.03% on Oct. 28.
- Calendar: The October jobs report is due Friday, Nov. 6 (economists expect about +59,000 jobs and a 4.2% unemployment rate); the next FOMC meeting is Dec. 9.
2. Insights From the Fool
Election Night Is Weather. Your Client’s Plan Is Climate.
Voters went to the polls Tuesday, and Democrats are projected to take control of both the House and the Senate, according to AP projections. Regardless of political affiliation, expect the same client question: “Should we be doing something?” History’s answer is mostly “no,” and it comes with receipts.
What the data say:
- The year after is usually good. Since 1874, the S&P 500 has risen in the 12 months after 32 of 38 midterm elections (84%), averaging a 14% total return versus 11% for any 12-month stretch, per The Motley Fool’s midterm research.
- The first month is a yawner. The average gain in the month after a midterm is just 0.5%, positive only 55% of the time. The payoff has historically shown up later: about +6% at three months and +10% at six months.
- Who wins matters less than clients think. Fool research found little connection between how many seats the president’s party loses and next-year returns. Divided government, the setup when a Democratic Congress sits alongside a Republican White House, has averaged 16% (positive 91% of the time) versus 12% (73%) for unified control, but the samples are small, so treat that as color, not a strategy.
- The midterm year is the bumpy part. Since 1932, midterm years have averaged about 5.8%, the weakest of the four-year cycle, yet the 12 months after averaged about 16.3%.
The honest caveat: This isn’t a textbook setup. The 10-year Treasury is near 4.8%, September CPI ran 3.7%, the Fed could raise rates again on Dec. 9, and the Nasdaq Composite has fallen into correction territory on AI-spending worries. History describes; it doesn’t promise.
Putting it to work with clients:
- Lead with the plan, not the poll. Point back to the investment policy statement. The allocation was built to survive elections of every flavor, so the burden of proof sits with any proposed change.
- Reframe the volatility. With the VIX near 27, the market is now pricing daily swings of roughly 1.7%. The S&P 500 gained 1.6% the day after the election and then lost 4.4% the day after that, a vivid reminder that one day’s move is a poor signal. The data say first-day reactions are mostly noise, and any payoff has historically come over the following months.
- Channel the urge to act. Clients who need to do something can rebalance to targets or tidy up old retirement accounts (see Section 6). Those moves actually change outcomes; guessing the policy winners doesn’t. And if a client mentions betting on results, last issue’s note from Tom Gardner on “casino” products is a handy touchstone.
Client-ready line: “An election changes the weather. Your plan was built for the climate. Nothing about a vote count changes your goals, your time horizon, or your need for income, so nothing about the plan needs to change either.”
The 10% Average Return Is Real. The 10% Year Is Rare.
The annualized return of the stock market (as measured by the performance of U.S. large-cap stocks) from 1928 to 2025 was 10.02%, according to the data of NYU professor Aswath Damodaran. But the number of individual calendar years that the market returned between 9.0% and 11.0% is just three (1968, 1993, and 2004). In other words, don’t expect anything close to that fabled 10% historical average return in any given year.
- Treat “10%” as a destination, not a forecast. An average is where the journey nets out over decades, not what any single year looks like. Try: “Ten percent is the long-run average, but almost no year actually delivers it. Expect big years and rough ones, and let the plan do the averaging.”
- Show ranges, not a straight line. A projection that compounds a flat 10% a year looks tidy and rarely resembles real life. Scenario ranges or Monte Carlo results set better expectations and make a down year feel like part of the plan.
- Raise the order of returns for near-retirees and retirees. Two portfolios can share the same average and end up in very different places depending on when the bad years land. That’s the case for cash reserves and flexible withdrawals.
3. Fund Insights & ETF Intelligence
ETF Face-Off: The Nasdaq-100 Fee War
With the Nasdaq-100 (the index of the 100 largest non-financial Nasdaq stocks) in correction, more than 10% below its October record, clients holding big-tech exposure are asking questions, and a newly crowded field gives you a reason to look under the hood. Four funds now track the same index:
Sources: Dow Jones via Tiger Brokers (fees, waiver), ETF Trends (launch dates).
What it means for your practice:
- Same index, same holdings. Expense ratio is the main structural difference. The gap between QQQ and QNDX is 0.08 percentage points, or $800 a year per $1 million.
- Don’t let 8 basis points drive a taxable sale. Selling QQQ to buy a cheaper twin realizes any embedded gain. Cost-cutting is easiest with new money and in tax-advantaged accounts.
- Kick the tires on size. IQQ had about $258 million in assets as of late July, while QQQ trades tens of millions of shares a day. For large tickets, check spreads before you commit.
- The bigger question is sizing, not the wrapper. All four own the same top-heavy portfolio (IQQ’s top 10 holdings were about 46% of assets in late July). A 10% pullback is a natural moment to revisit how much of a client’s equity sleeve rides on one index.
Product Watch: A Record Year for ETF Launches
Issuers have launched 1,159 ETFs through Oct. 20, already topping the full-year record of 1,143 set in 2025, with more than two months to go. The year has included a record $2.5 billion day-one debut from State Street and a single-day drop of 35 new funds from Corgi.
More choice is good; more noise is the cost. When a client forwards a shiny new ticker, a five-question screen keeps the conversation tidy:
- How seasoned is it? Does it have a track record through at least one rough patch, or only a launch-day chart?
- Can you trade it? Check assets, average volume, and bid-ask spreads, and the liquidity of what’s inside the fund.
- What’s the real fee? Find the post-waiver and pre-waiver expense ratios, and when the waiver ends.
- What does it do to the portfolio? Look at overlap with what the client already owns before you add anything.
- How is it taxed? Review the structure and distribution history, especially for options-overlay or active strategies.
Also on the radar: crypto ETF flows. U.S. spot Ether ETFs saw a record $1.61 billion of net outflows in October as Ether fell about 16%. Spot Bitcoin ETFs finished October about $515 million in the red after a $2.6 billion September, including a $643 million outflow on Oct. 30. Advisor takeaway: an ETF wrapper changes access, not volatility. If clients ask, revisit position size and rebalancing rules rather than the headline.
ETF Insights: Inflation Is Back
September CPI ran 3.7% year over year (up from 3.4% in August), core CPI hit 2.6%, and producer prices jumped 6.3%. Clients who hear “inflation” and reach for the best-known TIPS fund can evaluate some lower-cost or shorter-duration options:
How to use it:
- TIPS aren’t only an inflation hedge; they’re also a duration bet. Long TIPS funds can lose price when real yields rise, even while inflation accrues. With a December hike on the table, VTIP’s shorter profile is the lower-volatility way to keep the inflation link.
- Mind asset location. Annual inflation adjustments to principal are taxable as they accrue, so TIPS funds tend to fit better in IRAs and other tax-advantaged accounts than in taxable accounts.
- ETFs never mature. For a known future liability, such as a tuition bill or a retirement-income floor, individual TIPS held to maturity lock in a real return that a fund can’t.
4. Market & Rate Matrix
Key Benchmark ETF Performance
U.S.-FOCUSED
GLOBAL & FIXED INCOME
Source: Morningstar and exchange close data through Nov. 5th. 2026. Past performance is no guarantee of future results.
Interest Rate & Economic Indicators
5. Chart of the Week & Client Communication
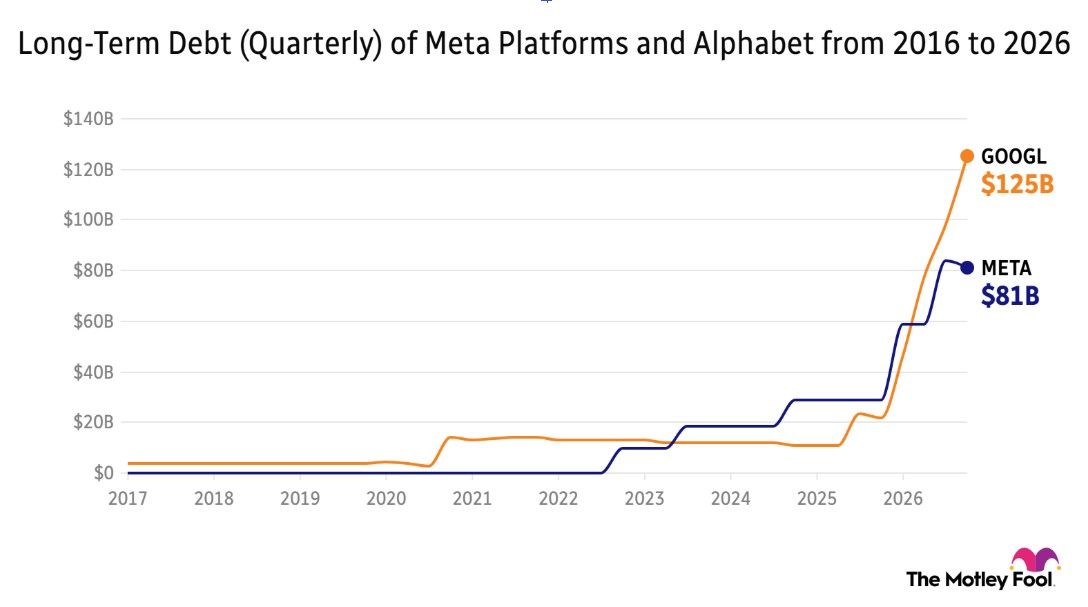
The Price of AI Is Climbing
Meta Platforms is eyeing at least $20 billion from a dollar-and-euro bond sale, its first-ever euro debt. That comes just a week after it unveiled roughly $25 billion in stock offerings. On the same Monday, Alphabet launched a seven-part, €6 billion ($6.7 billion) euro bond deal that drew more than €17 billion in orders. The catch is that lenders are demanding more. Alphabet paid richer yields than on an earlier 2026 deal, and Oracle is sweetening terms on a $10 billion sale. AI enthusiasm hasn’t vanished, but the price of funding it is climbing.
- The Credit Cops Weigh In: S&P moved Meta’s AA- outlook to negative Friday, arguing Meta has fewer ways than rivals to make money from AI. Meta expects 2026 capex of $135 billion to $145 billion and has disclosed roughly $825 billion in lease and contract commitments.
- Alphabet’s Worst Month on Record: Shares fell nearly 19% in October, including a 12%-plus drop in one day after earnings showed slower Search growth and cash burn. With 2026 capex of up to $205 billion, watch whether bond buyers keep showing up, and at what price.
Image source: The Motley Fool.
Client Meeting Talking Points
- Funding costs are the new AI scoreboard. Lenders demanding richer yields means the AI build-out is no longer free money, so earnings now depend on financing as well as demand. Try: “The AI story is still on, but the bill keeps getting bigger, and lenders are charging more to cover it.”
- Check the AI exposure hiding inside index funds. Clients in cap-weighted S&P 500 or Nasdaq-100 funds own these companies’ spending and borrowing decisions, even if they never bought a share directly. A quick look-through for overlap across a client’s holdings tells you how much of the portfolio rides on a handful of AI-linked names.
- Use credit as a second opinion. Bond buyers and rating agencies ask a different question than stock buyers: not “how fast can this grow?” but “how comfortably can this be paid back?” Try: “Stock investors cheer growth. Lenders ask who gets paid back first. It’s smart to listen to both.”
- Keep single-name swings in perspective. A nearly 19% monthly drop for one of the world’s largest companies is exactly why no single stock should carry a client’s plan. For clients with concentrated positions, including employee stock, last issue’s “scale in and scale out” idea from Tom Gardner makes a handy frame for a gradual trim plan.
6. Beyond Fooldom & Industry Briefing
Estate & Elder Planning: When Money Trouble Comes First
According to a study published in the Journal of the American Medical Association, Medicare beneficiaries living in single-person households who are diagnosed with Alzheimer disease and related dementias began missing bill payments up to six years before the diagnosis. They also had an increased risk of subprime credit scores 2.5 years prior to diagnosis. That time frame is confirmed by a study published by the National Bureau of Economic Research, which found that the financial fallout from dementia began six years before diagnosis.
What it means for your practice: The canary in the coal mine may be sitting in a client’s bill-pay history, years before anyone says the word “diagnosis.”
- Watch for the early signals. Missed payments, unexplained late fees, duplicate or forgotten transactions, or a once-meticulous client who suddenly struggles with routine money decisions.
- Give clients who live alone extra attention. No one else may be catching the slips.
- Plan while clients are still sharp. Document a trusted contact (within your firm’s rules), and review powers of attorney and successor trustee designations.
- Simplify and automate. Streamline bill paying, and make a household-finances check-in part of every regular review.
- Raise concerns with care. Do it privately. A missed payment is a cue to ask a question, not a conclusion to reach.
Practice Management: Small 401(k) Balances Don’t Survive Job Changes
New research from Vanguard and PensionBee suggests that workers who leave small 401(k) balances behind when they change jobs have few good options (InvestmentNews, Nov. 2). Auto portability through the Portability Services Network, which moves a small balance into the new employer’s plan, cut cash-outs for balances under $1,000 from about 50% to about 9%, but it did much less for balances of $1,000 to $7,000 (39% to 31%). The network’s reach is also thin: It covers only about 3% of U.S. 401(k) plans, and just 6% of the roughly 220,000 participants rolled through it have been matched to a new plan, leaving the rest in interim safe harbor IRAs. Those accounts can be costly, as PensionBee found that 68% of automatic rollover IRAs were worth less after one year, and most of their assets sit in cash-like investments earning roughly 0.5% to 2%. Ultimately, this means workers may be cashing out and losing retirement savings, or leaving them parked in low-yielding accounts where fees can outpace earnings.
How to apply this in your practice:
- Run an old-401(k) sweep. Ask every client, and every client’s adult children, a simple question: “Have you ever left a retirement account behind at a former employer?” Most people with a stranded account don’t know it can be moved without their consent (only 35% do, per earlier PensionBee research), so the question itself is the service.
- Treat consolidation as an active decision. A small balance can be rolled into a current employer plan or into an IRA that is actually invested. Compare fees and investments rather than accepting a default. A flat dollar fee is a rounding error on a large balance and a real drag on a small one.
- Head off the cash-out. Cashing out a small balance typically means income tax, and for clients under 59½ a likely early-withdrawal penalty on top. Frame it plainly: “That balance isn’t spending money, it’s the start of a retirement.”
- Help your business-owner clients. Ask whether their recordkeeper participates in auto portability, and whether their offboarding process tells departing employees about their options in plain English.
7. Number of the Week
Number of the Week
3.6%
The 2027 Social Security cost-of-living adjustment
Announced Oct. 14 and the largest since 2023.
- Average monthly benefit: about $2,088, so roughly $75 more a month
- Part B premium (Trustees’ projection): $209.50, up $6.60 from $202.90 (official figure expected mid-November)
Why It Matters to Advisors: A COLA headline isn’t a net-income number. Part B premiums are deducted from most retirees’ checks, and over this decade they have averaged 5.3% annual increases against 3.1% for COLAs. With September CPI at 3.7%, retirees will feel prices faster than a COLA arrives, so it’s a good week to stress-test withdrawal rates and healthcare-cost assumptions in client plans.
8. Quote of the Week
“Far more money has been lost by investors preparing for corrections, or trying to anticipate corrections, than has been lost in the corrections themselves.”
— Peter Lynch
“Far more money has been lost by investors preparing for corrections, or trying to anticipate corrections, than has been lost in the corrections themselves.”
— Peter Lynch