Did one headline just change the AVAX trend, or will sellers cap the rally at $9.022 again?
$AVAX trading at $8.51 as of Nov 10, 2026, 06:54 UTC. That's 8.0% higher over 24 hours, after Avalanche's official X account announced a NYSE-linked platform plan. This Avalanche price prediction builds on the November AVAX coverage.
AVAX 24-Hour Market Snapshot
CoinGecko market data, captured 06:54 UTC on Nov 10, 2026, ranks Avalanche 26 by market cap.
Metric
Value
Price
$8.51
24h change
+8.0%
Market cap
$3.794B
FDV
$4.007B
24h volume
$551.522M
Circulating supply
445.845M AVAX
Total supply
470.847M AVAX
Max supply
720M AVAX
Source: CoinGecko, AVAX market snapshot, captured Nov 10, 2026, 06:54 UTC
AVAX NYSE News and Catalyst
Tokenized securities are traditional shares recorded as tokens on a blockchain. Clearing and settlement is the step that confirms a trade and moves the cash and the asset. Per the official Avalanche X post, the planned NYSE-affiliated platform's core clearing and settlement layer will be built on Avalanche technology.
Source: Avalanche official X account (@avax), captured Nov 10, 2026, 06:54 UTC
The same post says Avalanche will support the platform's clearing firm and 24/7 trading, clearing, and settlement infrastructure.
If the platform goes live on Avalanche technology, the post becomes a working use case. If it slips, the 8.0% gain loses its catalyst.
AVAX ETF Flows From SoSoValue
SoSoValue ETF data as of Nov 9, 2026, UTC, shows $0.00 in daily net flow for spot $AVAX funds. Cumulative net inflow stands at $30.36M, and total net assets are $47.33M.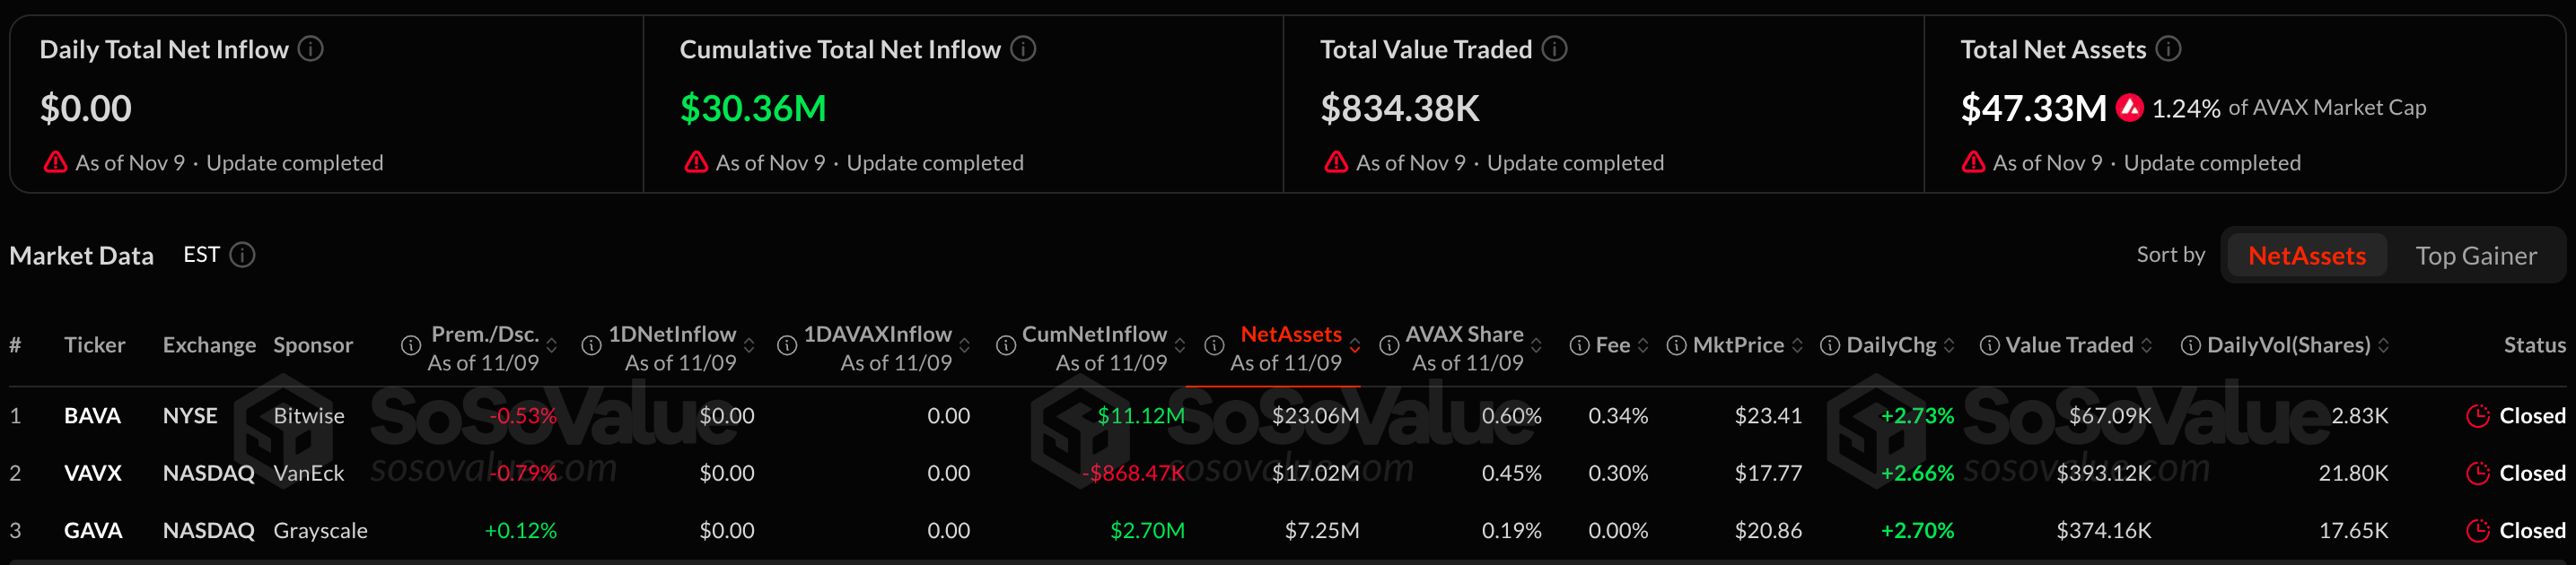
Source: SoSoValue, spot $AVAX ETF data as of Nov 9, 2026, UTC, captured Nov 10, 2026, 06:54 UTC
Bitwise's BAVA with $23.06M in net assets and $11.12M in cumulative inflow. VanEck's VAVX holds $17.02M, with a cumulative net outflow of $868.47K.
Method: figures come from the SoSoValue fund table. Flat daily flow means funds added no new demand on Nov 9, a detail worth reading alongside the latest crypto market news.
AVAX Liquidation Data Shows Longs Hit
Liquidation means an exchange forcibly ends a leveraged trade when losses exceed margin. Coinglass liquidation data at 06:54 UTC on Nov 10, 2026, shows $1.18M liquidated over 24 hours.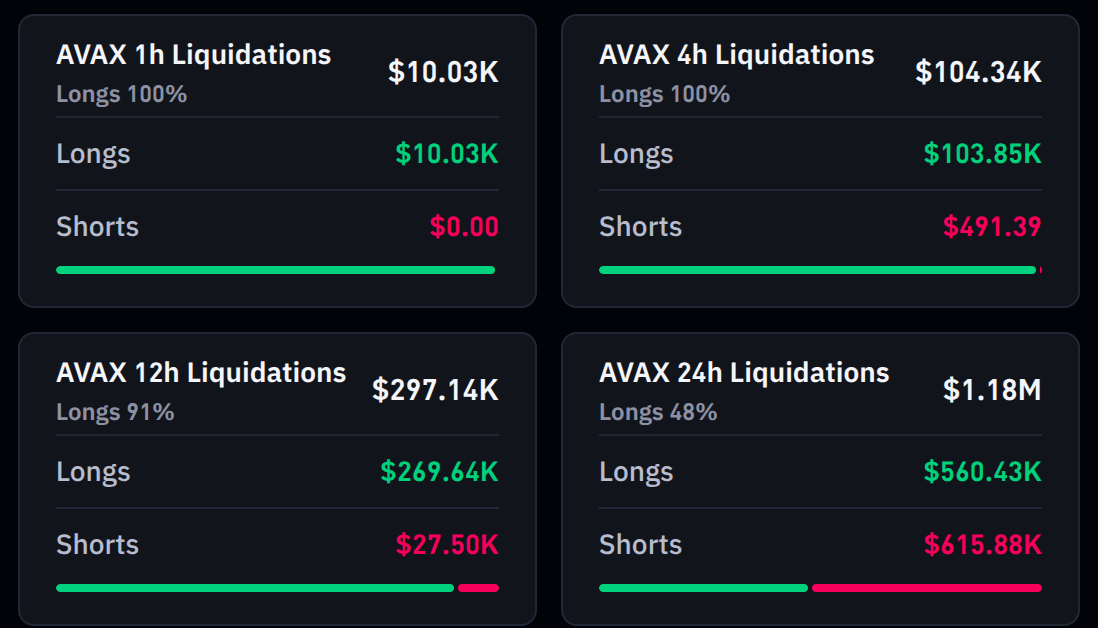
Source: CoinGlass, $AVAX liquidations, captured November 10, 2026, 06:54 UTC
Shorts lost $615.88K. Longs lost $560.43K. Over the last 12 hours, longs took the losses, at $269.64K against $27.50K for shorts.
AVAX Technical Analysis: 50-Day EMA and RSI Levels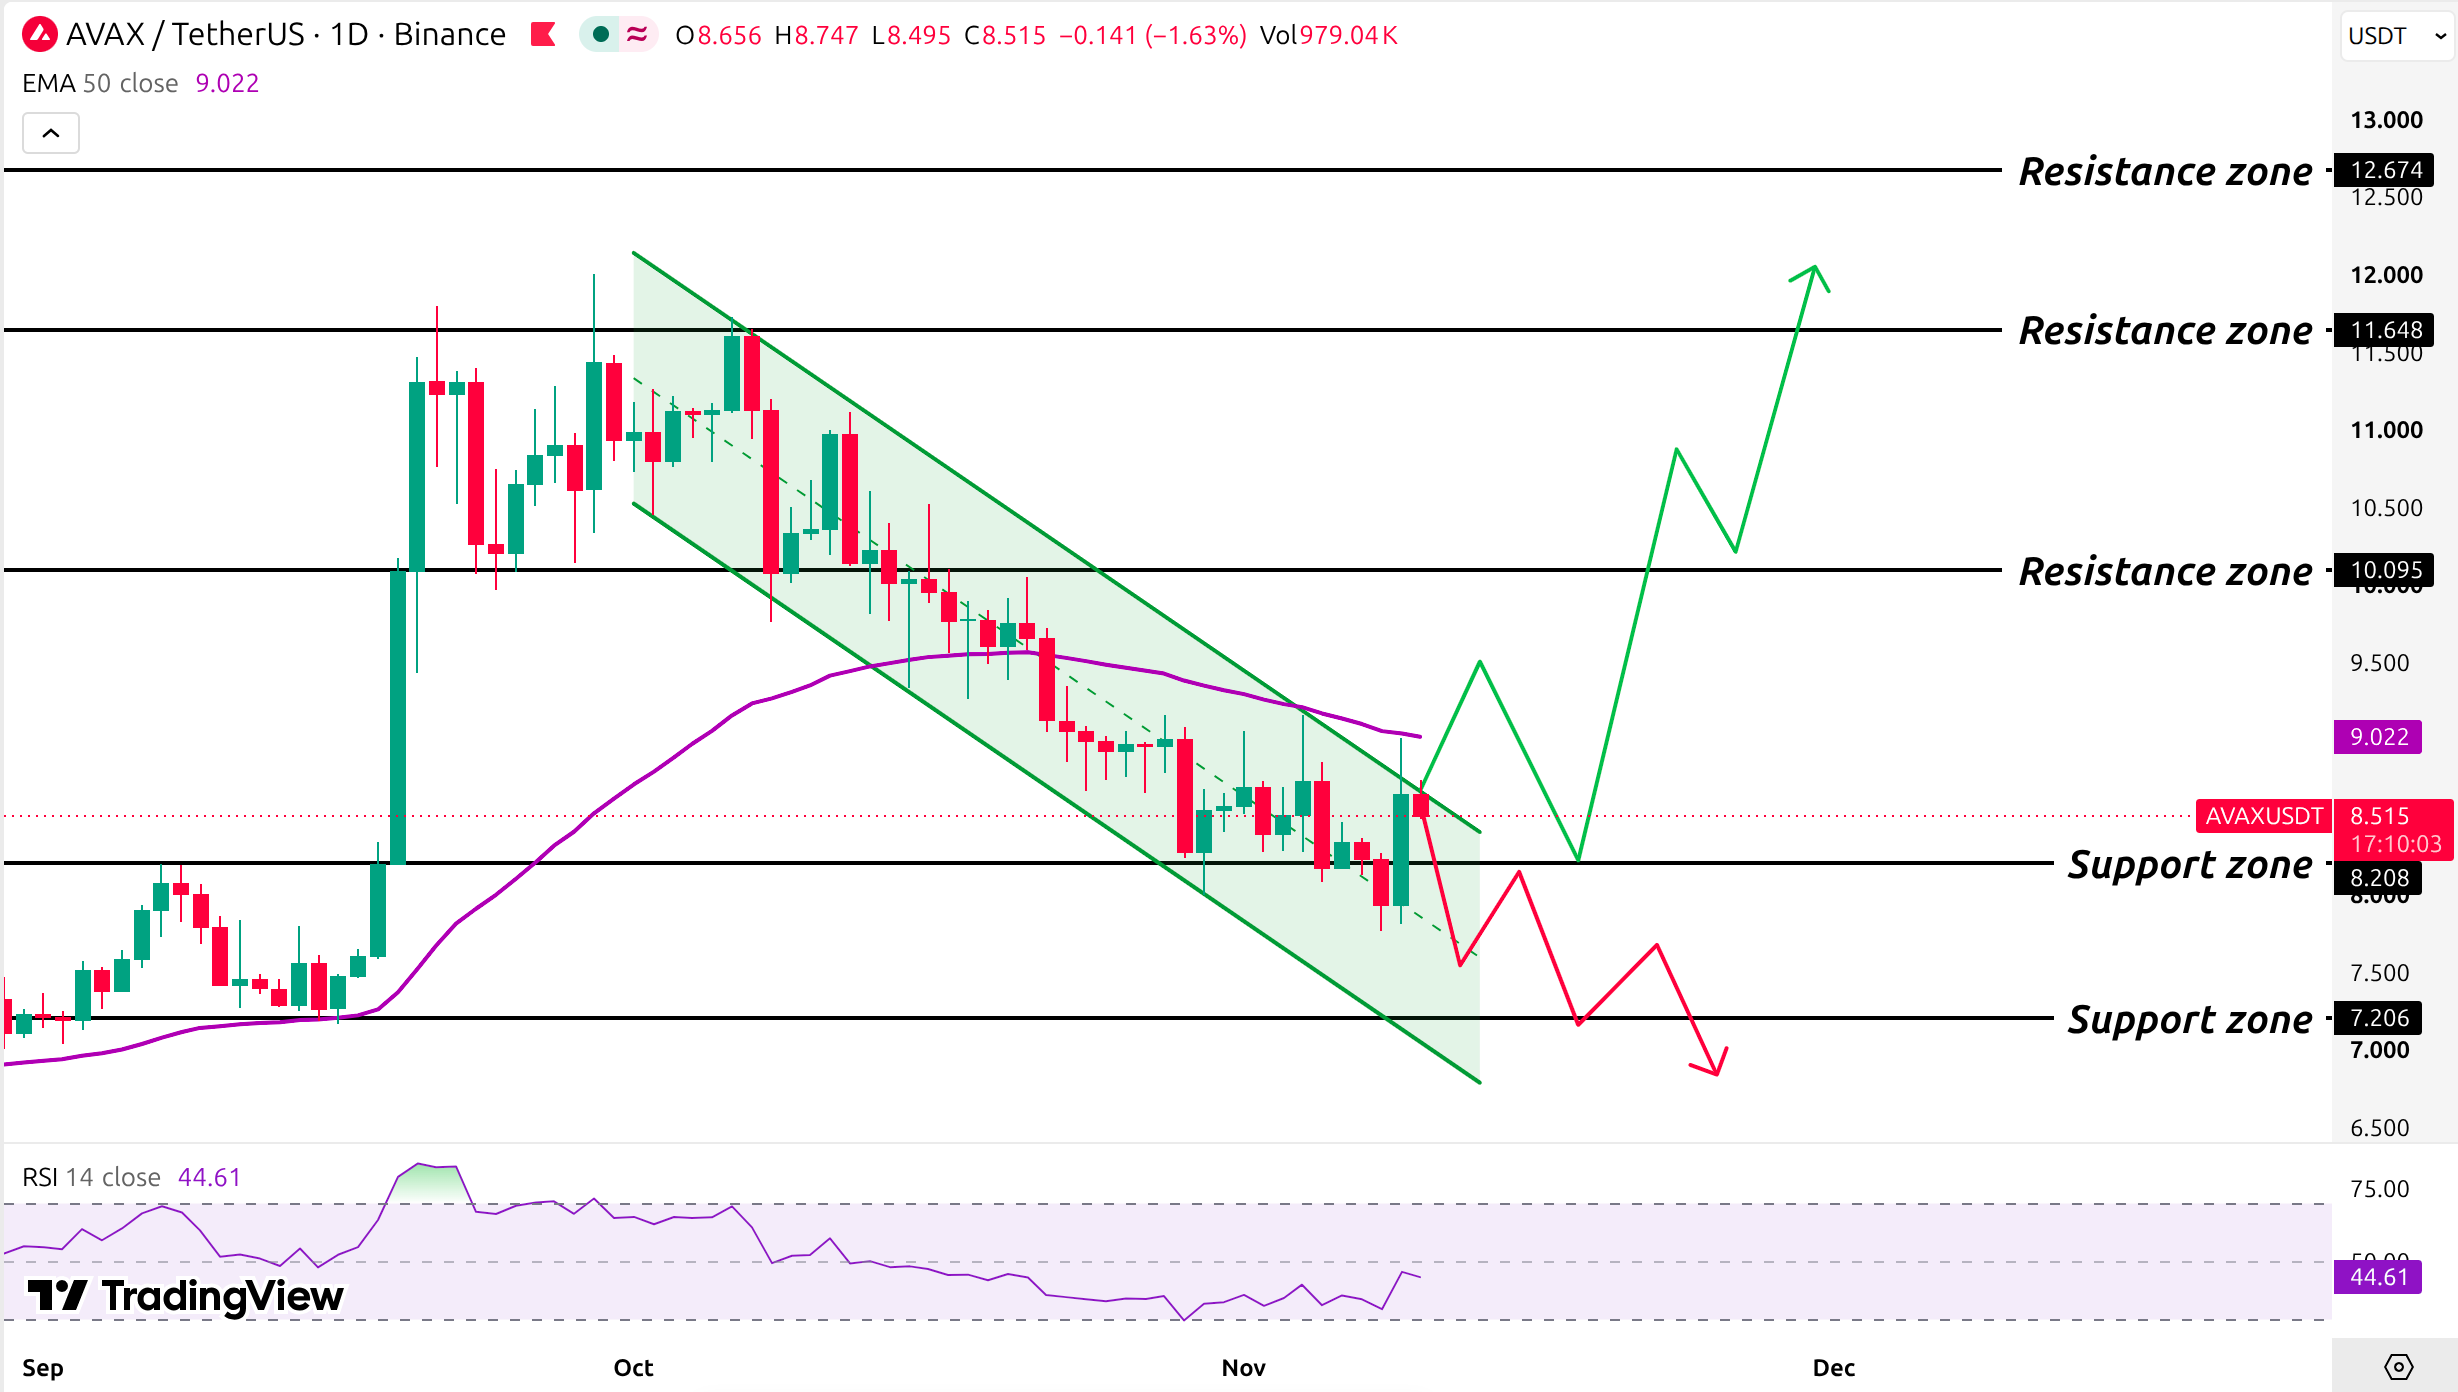
Source: TradingView, AVAX/USDT 1D, EMA 50, and RSI 14, November 10, 2026, 06:54 UTC
The Binance 1D chart for $AVAX/USDT on TradingView, captured Nov 10, 2026, 06:54 UTC, frames this Avalanche price prediction. A sharp September rally spiked to the $11.648 level before sellers took control.
Price held the $7.206 support zone, where buyers had stepped in, then rallied through $8.208 and $10.095, a run also tracked in the October Avalanche forecast, until the $11.648 resistance zone, where sellers had appeared and turned it back.
A descending channel, two falling parallel trendlines that hold price between support and resistance, formed from the early-October peak, and sellers defended the upper trendline of the channel every time. Right now, price trades above the $8.208 level but below the upper trendline of the channel and the $9.022 50-day EMA level.
The $AVAX 50-day EMA sits at $9.022, and $AVAX's $8.51 price trades 5.7% below it. The latest daily candle trades below the EMA. The upper trendline sits near it, so a real recovery needs both levels to break.
The $AVAX RSI reads 44.61 on the 14-day setting. Under 50 means sellers hold the momentum edge. A reading above 30 means oversold conditions haven't formed and price has room to fall.
AVAX Support Levels and Resistance Levels
Level
Role
$7.206
Support
$8.208
Support
$9.022
50-day EMA
$10.095
Resistance
$11.648
Resistance
$12.674
Resistance
Support marks where buyers have stepped in. Resistance marks where sellers have. The nearest levels are $8.208 below and $9.022 above.
Avalanche Price Prediction: Bull, Base, and Bear Scenarios
Scenario
Trigger
Target
Invalidation
Bull
Daily candle trades above the $9.022 EMA level
$10.095
Back below the $8.208 level
Base
Range between $8.208 and $9.022 levels
Range trade
Break of either level
Bear
Daily candle trades below the $8.208 level
$7.206
Daily candle trades above the $9.022 level
Regulatory delay is a risk, since the NYSE-linked platform is still upcoming. ETF flow reversal is another, because net outflows remove a small bid. Technical invalidation means a daily candle trading above $9.022 for bears or below $8.208 for bulls.
Expert Outlook on the Avalanche Price Prediction
As per CoinGabbar analysis, The base range wins for now. ETF flow sits at $0.00, price trades 5.7% under the 50-day EMA, and liquidations show a futures-led rally. Watch the next SoSoValue update, since a positive net inflow with a daily candle above $9.022 would confirm spot demand.
Disclaimer: This article is for information only and isn't financial advice. Traders should do their own research and risk only what they can afford to lose.
About the Author Dikshant Dibbey
Technical Analyst at coingabbar.com
Dikshant Dibbey is a crypto technical analyst with two years of knowledge and experience in the cryptocurrency and Web3 space. He has a strong interest in analyzing Bitcoin, altcoins, blockchain technology, and the evolving digital asset market. His focus is on understanding market trends, price movements, and technical indicators to help readers gain a clearer perspective on the crypto market. Through his content, Dikshant aims to simplify complex cryptocurrency concepts and provide readers with insightful, accurate, and easy-to-understand information.
 November 9, 2026
November 5, 2026
November 5, 2026
November 5, 2026
November 5, 2026
November 3, 2026
November 3, 2026
November 3, 2026
Frequently Asked Questions (FAQ)