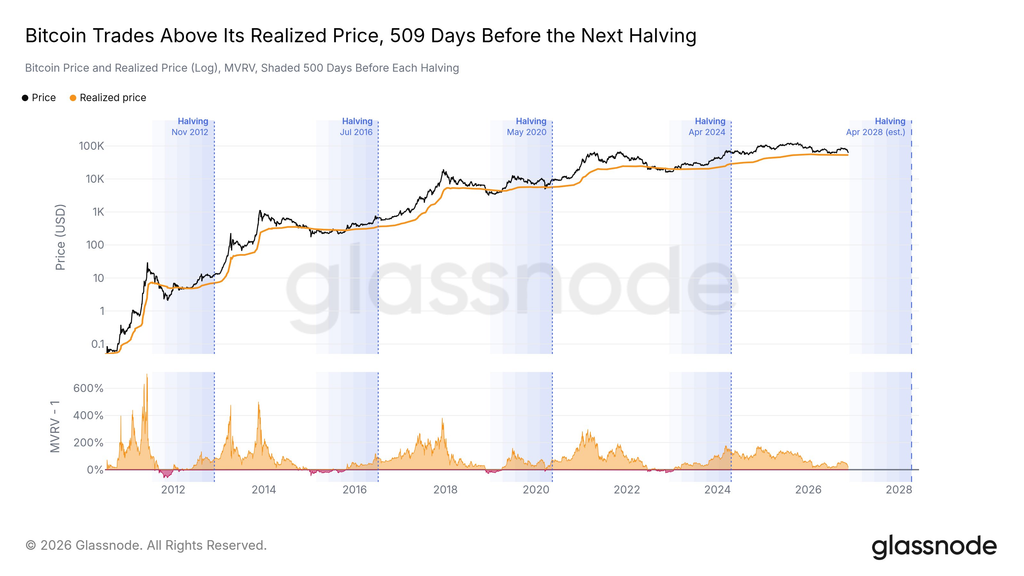
Bitcoin holders have given back most of their paper gains in the latest crypto crash. Glassnode reported on November 20 that BTC still trades above its realized price, an estimate of the average cost per coin. The gap is now small enough that another leg down could leave holders nursing a loss on average for the first time since early 2023.
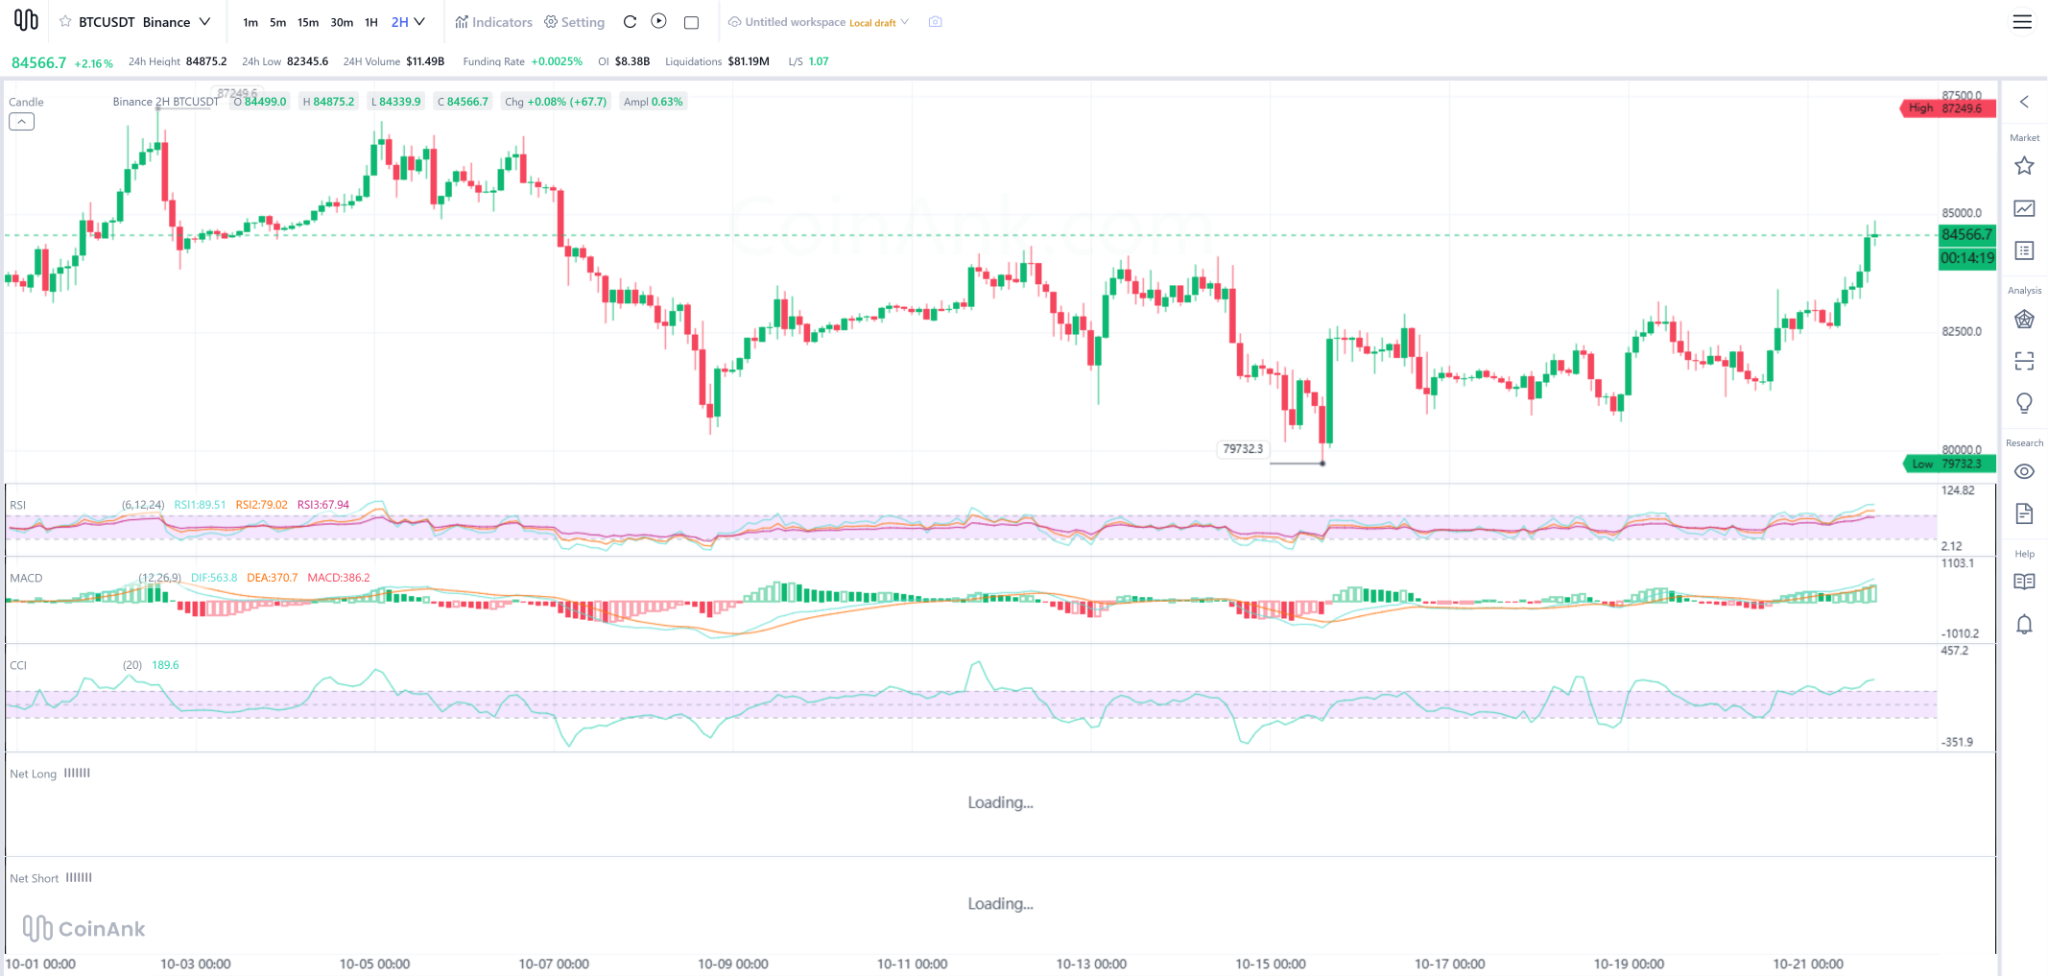
The change is visible on Glassnode’s chart. Bitcoin traded above $100,000 in 2025, well above the orange line that tracks its realized price. Since then, BTC has fallen in a series of drops and brief recoveries. The orange line has barely moved in recent months. Most of the gap closed because Bitcoin got cheaper.
How Much of Bitcoin’s Profit Cushion Is Left?
The lower half of the chart puts the selloff in perspective. It tracks Bitcoin’s market value relative to its realized value, known as MVRV. Glassnode subtracts 1 from the ratio and plots the result as a percentage, so zero on the chart is where the market breaks even.
Around the April 2024 halving, that reading briefly approached 200%. In plain terms, BTC was trading at close to three times its estimated average cost. By November 2026, almost all of that cushion had gone. Glassnode put MVRV just above 1 in its latest update, leaving only a thin strip of orange above the zero line.
Individual holders can have very different returns. Glassnode uses the price at which each coin last moved on the network to estimate its cost. A bitcoin that last moved at $10,000 still carries a sizable paper gain. Someone who bought above $100,000 is already well underwater. Both count toward the same average.
Read also: Bitcoin’s Bear Market Could End in 30 to 45 Days – Here’s Why
What Happened the Last Time Bitcoin Fell Below Its Realized Price?
The pink stretches along the bottom of the chart show when holders slipped into a loss overall. In 2022, Bitcoin spent months trading around or below its realized price before recovering in early 2023. Earlier declines in 2015 and late 2018 also took BTC below that line. In each case, buyers had time to buy below the network’s average cost even after the first crossing.
Glassnode published its chart an estimated 509 days before the next Bitcoin halving, expected in April 2028. That puts BTC nine days outside the blue 500-day window marked on the chart. Ahead of the April 2024 halving, Bitcoin entered that window with holders already underwater.
This time, they’re approaching it with a small gain still intact. If the two price lines cross again, that gain disappears on paper. The 2022 stretch shows how long it can take to earn it back.
For more crypto news and price predictions, click here.
Subscribe to our YouTube channel for daily crypto updates, market insights, and expert analysis.