Bitcoin 200-Week Moving Average Break: Deeper BTC Levels Now in Focus?
Bitcoin had a tough week. According to Coinbase Institutional's weekly market report dated November 20, BTC fell about 12% over the past week and broke below its 200-week moving average.
The report links the move mainly to rising US real interest rates and expectations of more Federal Reserve rate hikes.
This article explains what the Bitcoin 200-week moving average is, why the break matters, and which price levels the report highlights.
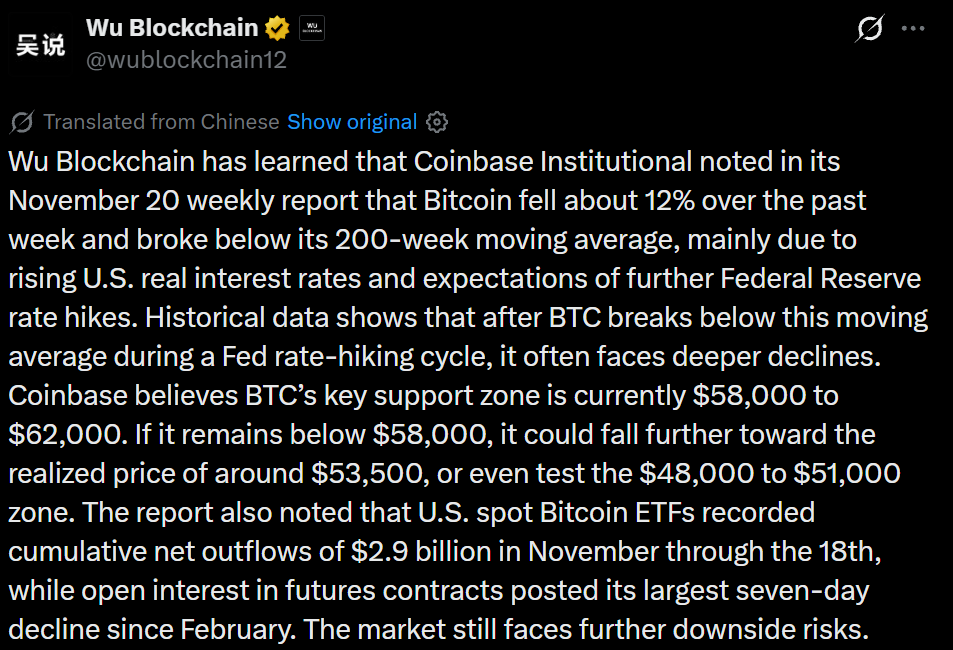
Source: Wu Blockchain Post
What Coinbase Institutional's Weekly Report Says
The report covers price levels, interest rates and market data. Here are the main points:
Item
What the report says
Weekly move
Key signal
Break below the 200-week moving average
Main driver
Rising US real interest rates and expected Fed rate hikes
Key support zone
$58,000 to $62,000
Deeper levels
Realized price near $53,500, then $48,000 to $51,000
Spot ETF flows
$2.9 billion net outflows in November through the 18th
Futures market
Largest seven-day fall in open interest since February
The report's overall view is that the market still faces further downside risks.
Why Bitcoin Fell: Rising Real Rates and Fed Hike Expectations
Coinbase says the drop was mainly due to two linked things: rising US real interest rates and expectations of further Fed rate hikes.
-
Real interest rates are interest rates after inflation is taken out. When they rise, holding cash or government bonds becomes more rewarding.
-
Fed rate hikes make borrowing more expensive and often reduce appetite for riskier assets.
Real interest rates are interest rates after inflation is taken out. When they rise, holding cash or government bonds becomes more rewarding.
Fed rate hikes make borrowing more expensive and often reduce appetite for riskier assets.
In general, higher rates can pull money away from assets like Bitcoin, which pay no interest. This is a general explanation, not a quote from the report.
Why the Bitcoin 200-Week Moving Average Matters
A moving average shows the average closing price over a set period. The 200-week version covers about four years, so traders often treat it as a long-term guide. Many watch it as a major trend line.
Coinbase notes that , according to historical data, when BTC breaks below this average during a Fed rate-hiking cycle, it often faces deeper declines.
word "often" is important: this is a pattern, not a rule. Still, it explains why the Bitcoin 200-week moving average break drew attention in the report.
Key Price Levels Coinbase Is Watching
The report names several levels that could matter next:
Level
What it means
$58,000 to $62,000
The key support zone, where buyers may step in
Below $58,000
If BTC stays below this, a further fall is possible
About $53,500
The realized price, a long-term cost measure
$48,000 to $51,000
A deeper zone that could be tested if selling continues
The realized price is often seen as the average price at which existing coins last moved on the network.
The $53,500 level sits about $4,500 below the lower edge of the support zone. Coinbase's wording is conditional: these levels come into play only if Bitcoin stays below $58,000.
ETF Outflows and Futures Data Show Weaker Demand
Two other numbers in the report point to cooling demand:
-
Spot Bitcoin ETFs: US spot Bitcoin ETFs recorded cumulative net outflows of $2.9 billion in November through the 18th. Net outflows mean more money left these funds than entered them.
-
Futures open interest: Open interest, meaning the total number of open futures contracts, posted its largest seven-day decline since February. This suggests traders are closing positions.
Spot Bitcoin ETFs: US spot Bitcoin ETFs recorded cumulative net outflows of $2.9 billion in November through the 18th. Net outflows mean more money left these funds than entered them.
Futures open interest: Open interest, meaning the total number of open futures contracts, posted its largest seven-day decline since February. This suggests traders are closing positions.
Together, these point to less buying pressure. They help explain why the Bitcoin 200-week moving average break came with caution from Coinbase.
Conclusion
Bitcoin fell about 12% in a week and slipped below a long-term trend line, while rate-hike worries and ETF outflows added pressure.
Coinbase sees $58,000 to $62,000 as the key support zone, with deeper levels near $53,500 and $48,000 to $51,000 if that zone fails.
The Bitcoin 200-week moving average is the signal to follow. These are Coinbase's views, not guarantees, and this article is not financial advice.
Disclaimer
This article is for educational and informational purposes only and is not financial or investment advice. Crypto assets are high risk, their prices can be very volatile, and you can lose some or all of your money. Always do your own research and consider speaking with a licensed financial advisor before making investment decisions.
About the Author Bablu Singh Nirwan
English Blog Writer at coingabbar.com
Bablu Singh Nirwan is a Content Writer with 6 months of experience covering blockchain, cryptocurrency, Web3, and digital finance. He specializes in researching emerging trends, simplifying complex topics, and creating SEO-optimized content. His work focuses on clarity, accuracy, and engaging insights that keep readers informed about the evolving crypto industry.
Frequently Asked Questions (FAQ)