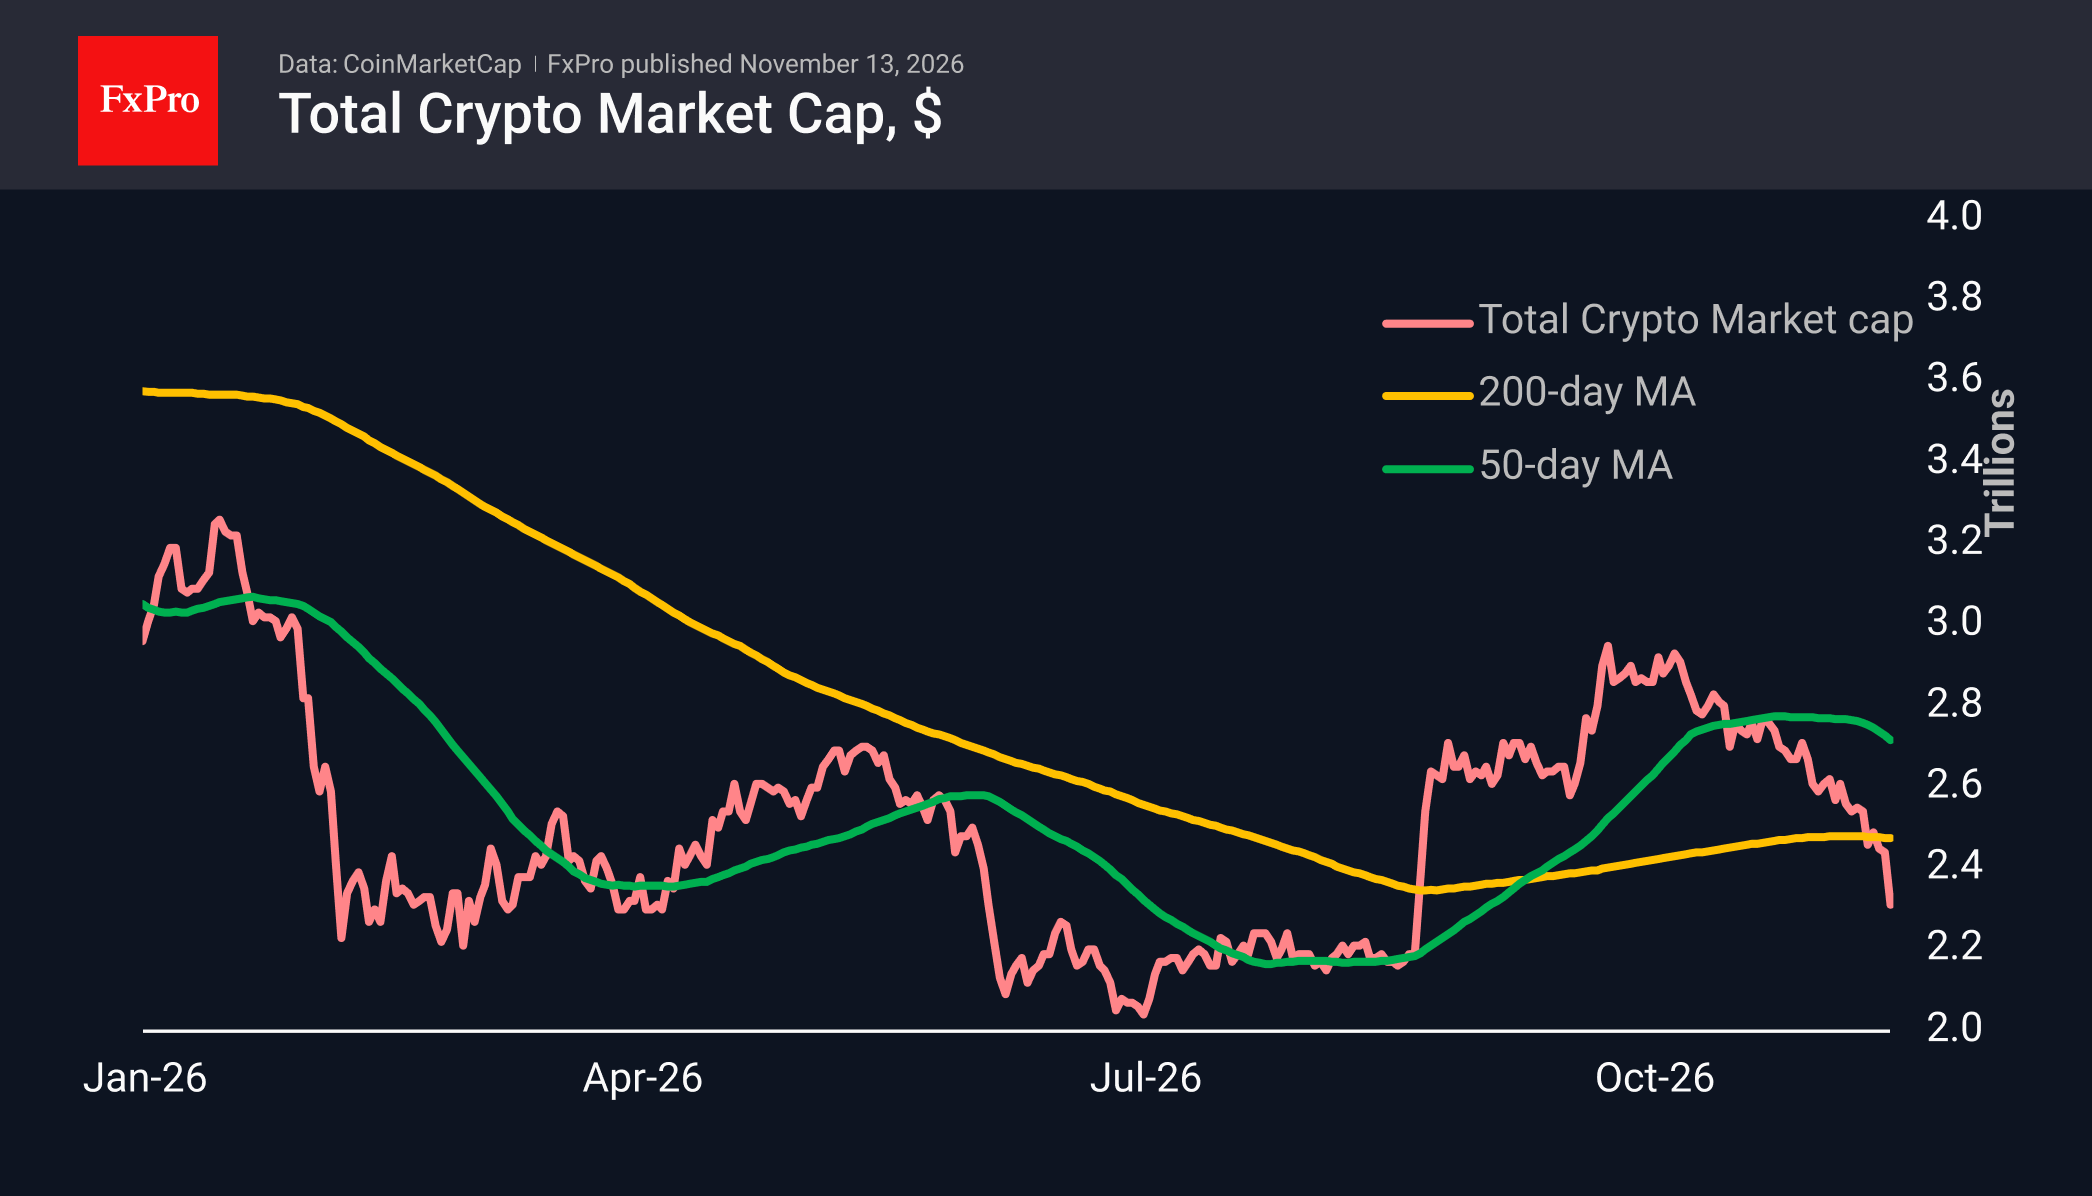
- The crypto market capitalisation fell by 5.3% in 24 hours to $2.32T, and the sentiment index dropped to 20, signalling extreme fear.
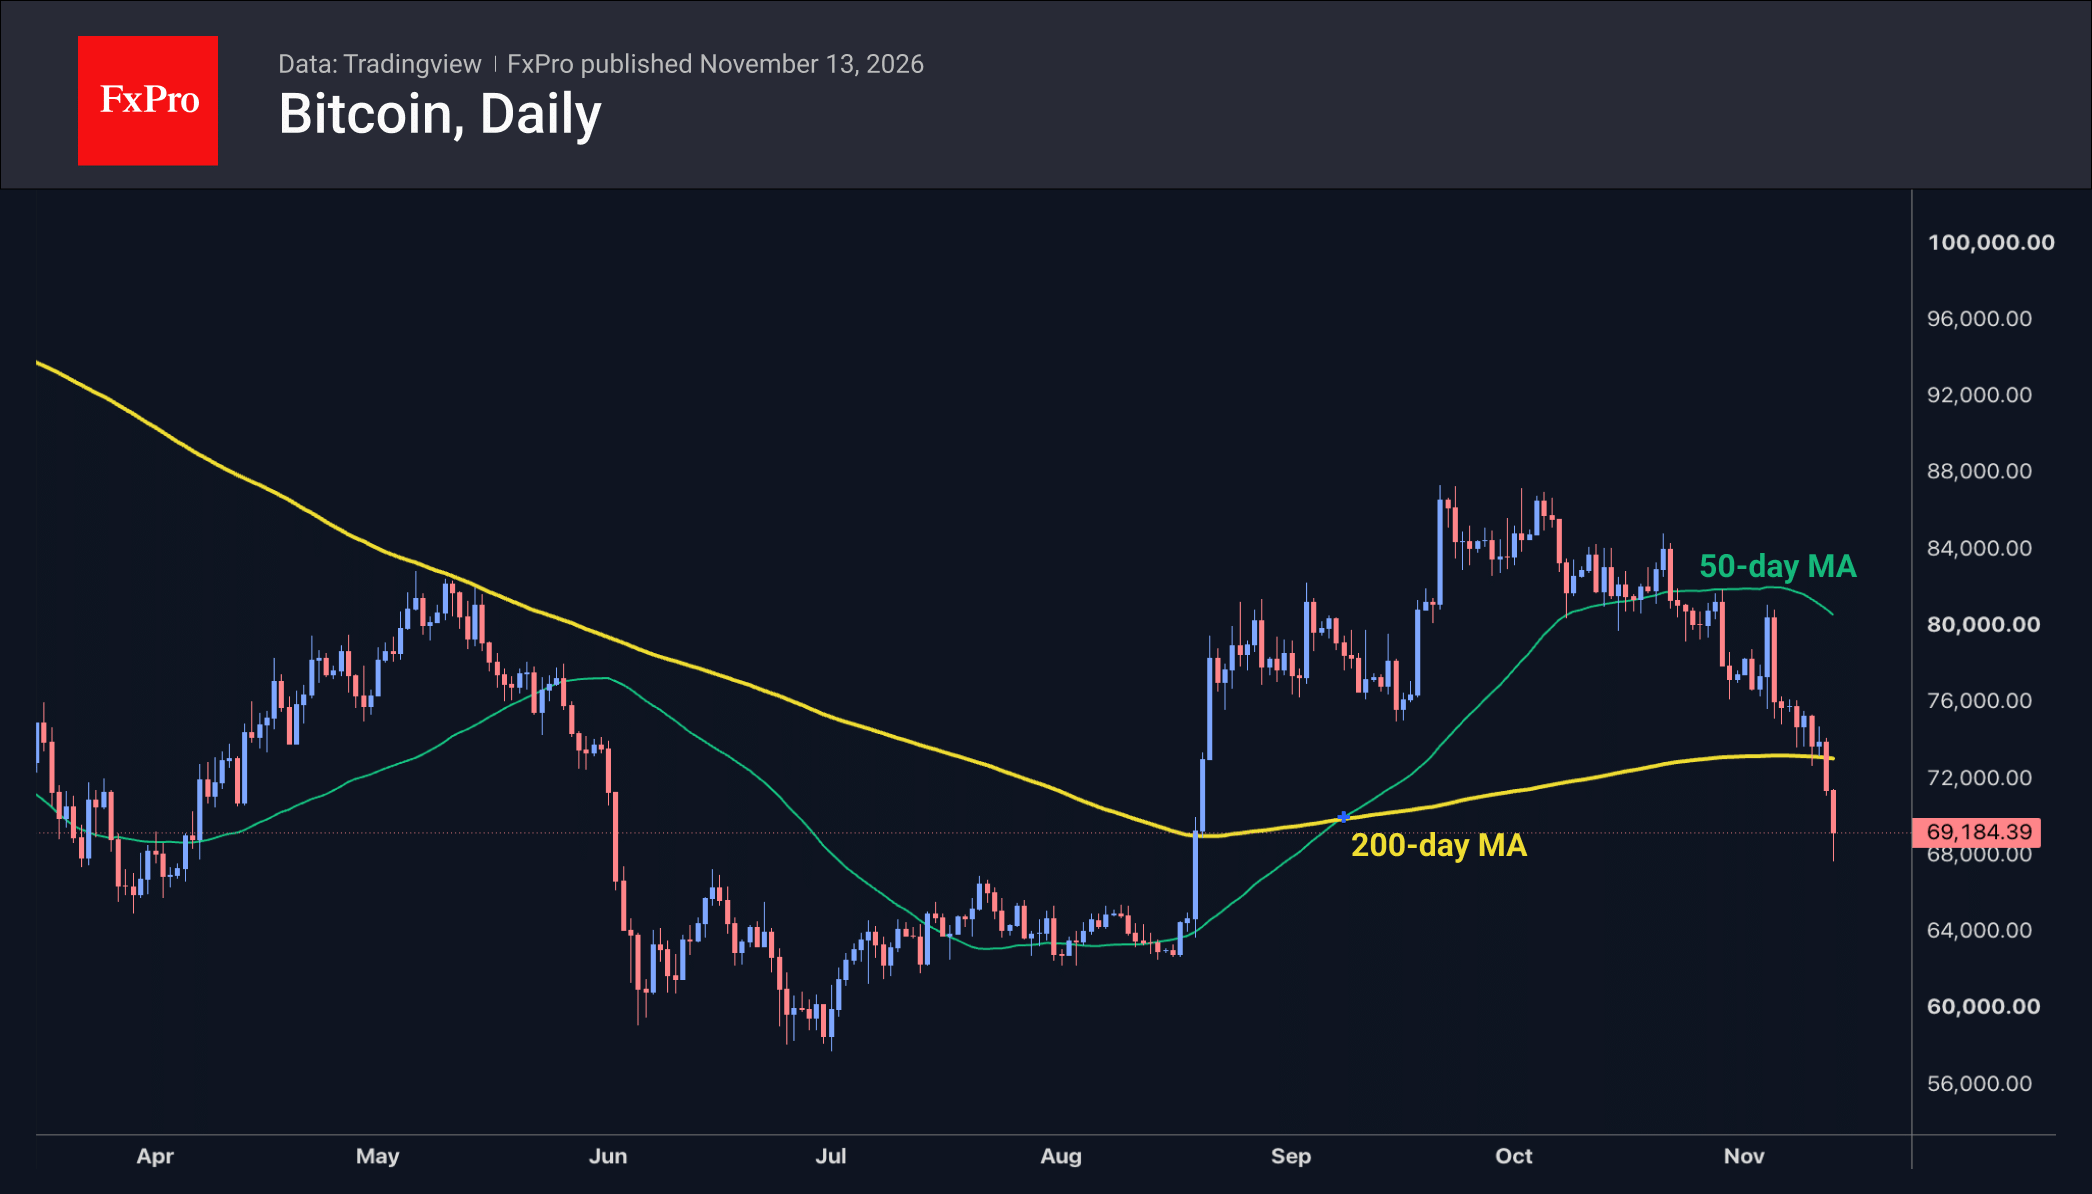
- Bitcoin dipped below $67.5K and is testing its 200-week moving average; the next target is $63–66K.
- Outflows from BlackRock’s Bitcoin ETF (around $2 billion) and a $14.2 billion drop in stablecoin supply are draining market liquidity.
Market Overview
The crypto market capitalisation has fallen by 5.3% over the past 24 hours to $2.32T as of 07:00 GMT, accelerating its decline to levels not seen since 19 August. The Alternative.me Crypto Fear & Greed Index plummeted to 20, its lowest level since July, entering the extreme fear zone. One reason for such low readings was that the market was in the midst of a sharp sell-off when the daily indicator was calculated at midnight GMT.
Bitcoin briefly dipped below $67.5K at 05:45 GMT on Friday, extending its losses since the start of 12 November to 9%. The latest leg of the sell-off coincided with a period of low liquidity ahead of the start of active trading in Europe. During such periods, the market often moves as pending orders are executed if the price breaks out of an established trading range, as was the case this time. Later, we saw attempts at a rebound and stabilisation, but the price failed to sustain a move back above $69K. This is a rather alarming acceleration of the sell-off following the breach below the 200-day moving average, which suggests the downtrend is likely to continue. We previously indicated that the $63–66K region could be the next target. That said, in the short term, the Relative Strength Index (RSI) is oversold on the daily timeframe. RSI readings below 30 do not, in themselves, constitute a buy signal; we need to wait for a price rebound accompanied by the RSI moving out of oversold territory.
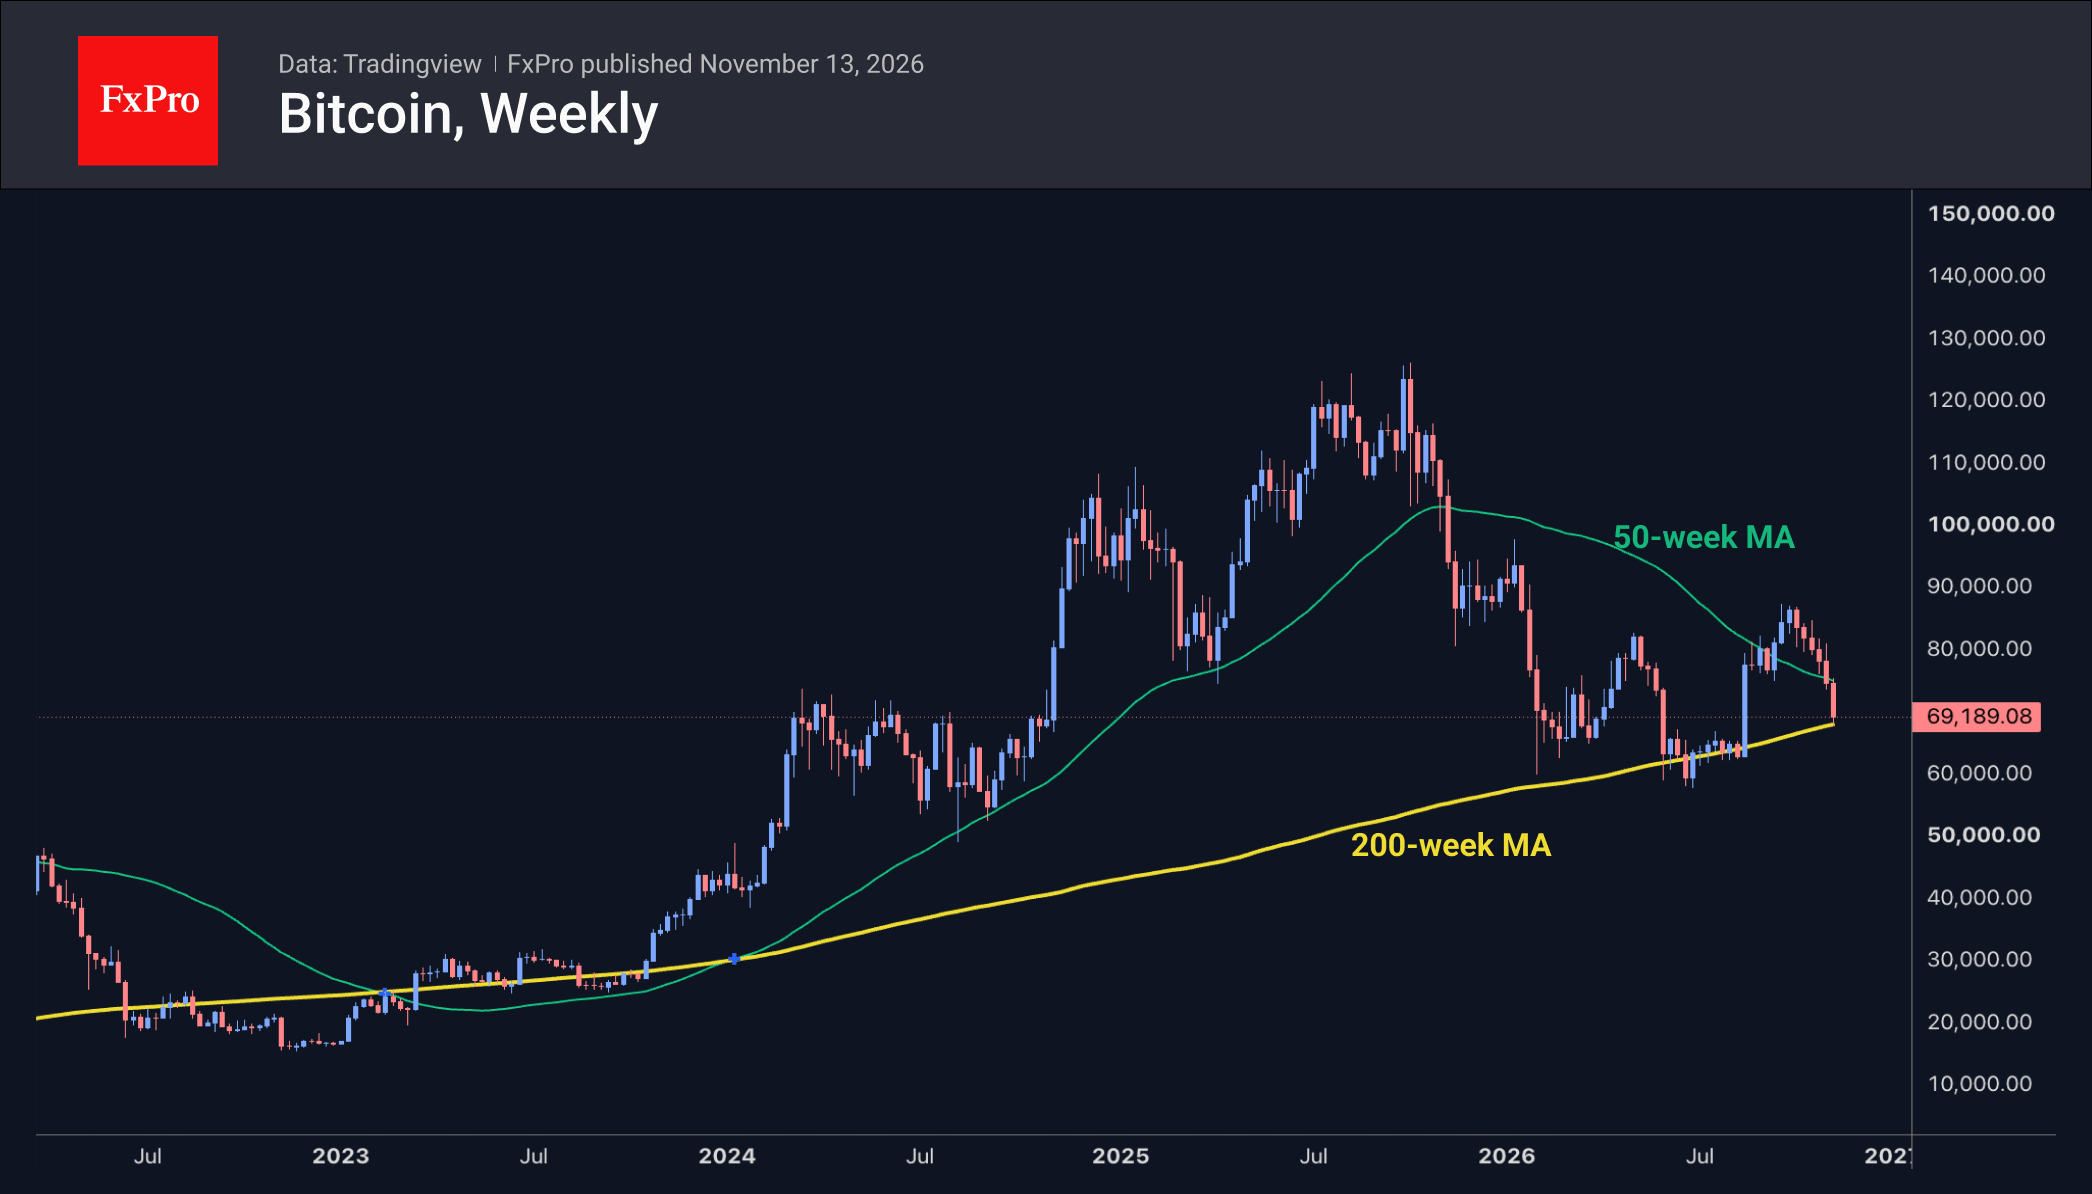
On the weekly timeframe, the picture is also quite interesting, as the price is testing the 200-week moving average after accelerating its decline following a break below the 50-week MA. Overall, the current downtrend has lasted six weeks, erasing around a quarter of Bitcoin’s value during this period. The return to this line came after 13 weeks of trading above it, the longest period above the line in a bull market. Over the years, touches of and dips below the 200-week moving average have become common for the leading cryptocurrency: in 2018 and 2020, touches of this line marked the bottom of a bear market, while in June 2022, a 16-month crypto winter began with a fairly prolonged dip below this curve and comparatively moderate growth above it. This year, a 40% rise from the long-term moving average has given way to a decline, and the price is only 10% above the starting level of the August rally. We doubt that crypto winters are becoming more frequent.
News Background
Index provider MSCI will exclude the Bitcoin treasury companies Strategy and Metaplanet from the MSCI USA and MSCI Japan Small Cap indices, respectively. The decision is linked to new assessment criteria for companies that are effectively engaged in asset custody. The exclusion may force index funds to sell shares in both companies. JPMorgan had previously estimated potential sales of Strategy shares in such a scenario at $2.8 billion.
According to Farside Investors, investors have withdrawn around $2 billion from BlackRock’s spot Bitcoin ETF over nine trading sessions, with outflows continuing since 30 October.
The total supply of stablecoins has fallen by $14.2 billion over 30 days, according to Glassnode. This is the fastest rate of decline since June 2022. Investors are withdrawing funds from the crypto market into fiat, reducing liquidity and hindering the recovery of crypto assets.
CryptoQuant notes that Bitcoin futures liquidations on Binance over the past three months have reached their highest level since 2021. Open interest in BTC has fallen by 17% in less than a month, signalling deleveraging.
Mining company Hyperscale Data has sold all its remaining bitcoins (around 211 BTC). ASIC miner manufacturer Canaan has not ruled out further sales of its crypto reserves as its share price has fallen by 75% since the start of the year.
What to watch
Invalidation: a return of Bitcoin above $73K, back to the 200-day moving average after the slip below it.
Risk: triggered stop-loss orders and ETF outflows could accelerate the fall towards $63–66K.
Upcoming: an RSI move out of oversold territory together with a price rebound would signal a bounce; US producer prices are due on 13 November at 13:30 GMT. Check the economic calendar for more events.
The FxPro Analyst Team
Get daily and weekly ActionForex analysis and key releases on our Telegram channel.