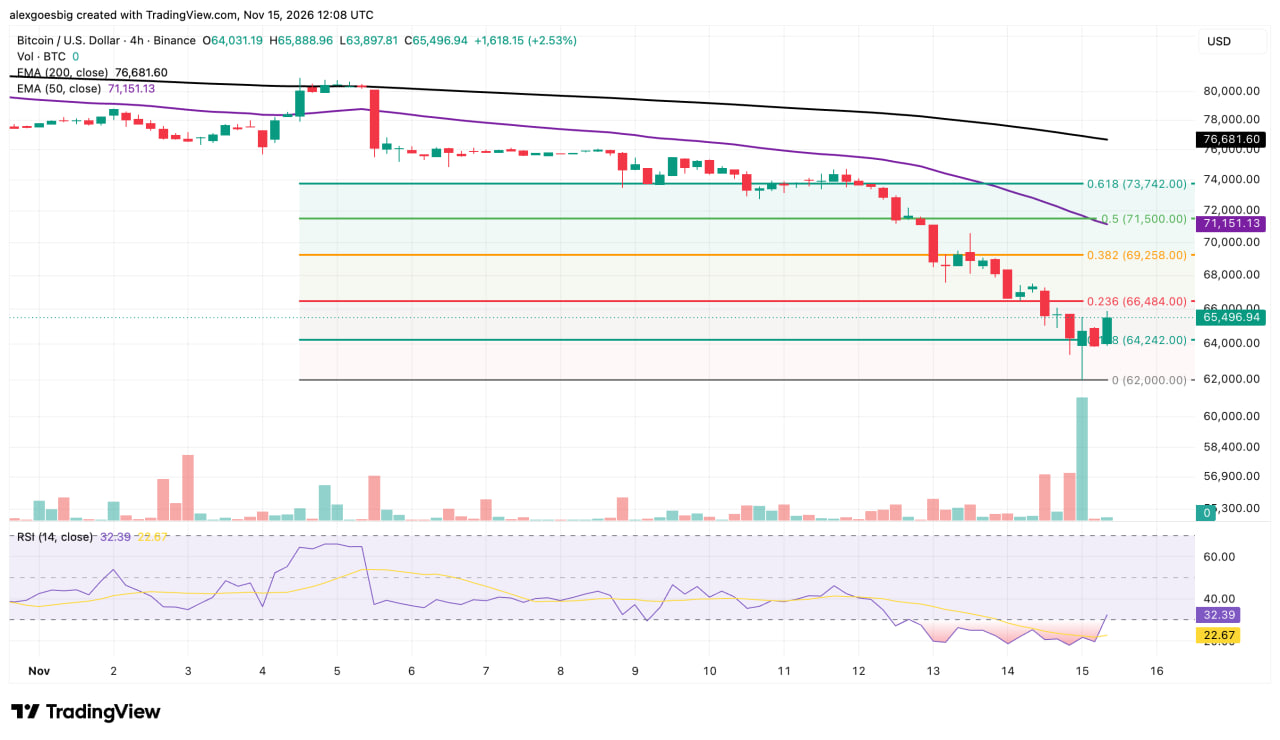
- Bitcoin price rebounded from a key Fibonacci floor after a weekend liquidation flush.
- Leveraged long traders absorbed most of the forced closures across crypto markets.
- BlackRock’s IBIT drove nearly all spot Bitcoin ETF outflows in November.
- The broader trend stays bearish while price trades below both major moving averages.
Bitcoin recovered to about $65,500 on Sunday, November 15, hours after a weekend selloff dragged it down to $62,000 and wiped out roughly $1.68 billion in leveraged long positions across crypto derivatives venues. The bounce follows a heavy stretch for U.S. spot Bitcoin ETFs, which lost a net $2.66 billion between October 27 and November 13, mostly through redemptions in BlackRock’s iShares Bitcoin Trust (IBIT). Sentiment has followed price lower, with CoinMarketCap’s Fear & Greed Index reading 13, deep in extreme fear.
Longs Absorbed $1.68B of a $2B Flush
Liquidation data from CoinGlass shows $2.02 billion in forced position closures over 24 hours, with longs accounting for $1.68 billion and shorts for $334.85 million. Bitcoin contracts made up the largest share at $802.51 million, about three quarters of it from long positions, while Ether followed with $489.87 million and a long share of 82.6%.
Know when your
coins move
The most lopsided book belonged to HYPE, the native token of the Hyperliquid exchange, where longs made up 97.4% of the $87.30 million liquidated. Solana and XRP contracts added $89.67 million and $47.63 million respectively. Even gold perpetuals (XAU) saw $31.55 million cleared, as traders who use crypto venues for commodity exposure got caught in the same margin calls.
Why the Drop Accelerated Over the Weekend
Every leveraged position carries a price at which the exchange closes it automatically once the trader’s collateral runs thin. When Bitcoin slides into a cluster of those levels, the forced closures hit the market as sell orders, push price lower and set off the next cluster in line. The four-hour chart shows that sequence: the candle that printed the $62,000 low carried the largest volume bar of the month, and the recovery candles after it traded on a fraction of that volume, which suggests the bounce has so far drawn limited fresh buying.
The weekend timing made the move sharper, because spot ETFs do not trade on Saturdays and Sundays and exchange order books tend to thin out, which gave derivatives positioning an outsized influence on price between Friday’s close and Sunday morning. ETF redemptions hit the market through a separate channel on weekdays, because when IBIT shareholders cash out and the fund shrinks, it delivers or sells Bitcoin to meet those redemptions, turning investor withdrawals into supply in the spot market.
IBIT Drove About 90% of November’s Outflows
According to Farside Investors, U.S. spot Bitcoin ETFs recorded net outflows in 10 of the 14 sessions between October 27 and November 13, with the worst day on October 30, when the group lost $643.2 million. The two full November weeks produced $2.35 billion in net withdrawals, and IBIT accounted for $2.12 billion of that.
IBIT has now posted 11 consecutive sessions of outflows totaling $2.35 billion since October 30, including $908.4 million in the week of November 9 to 13. The figures track money investors pulled out of the fund, and BlackRock has not necessarily sold any Bitcoin of its own.
Fidelity’s FBTC held up better, finishing the two November weeks almost flat at about -$18 million thanks to a $236.7 million inflow on November 4, while Morgan Stanley’s MSBT, the cheapest fund in the group at a 0.14% fee, took in $57.7 million without a single outflow day.
Net flows, U.S. spot Bitcoin ETFs. Source: Farside Investors
The Bounce Meets Resistance Near $66,500
The Fibonacci retracement on the chart runs from the November 5 high near $81,000 down to the $62,000 low, a decline of about 23%. Bitcoin has reclaimed the 0.118 level at $64,242, which now serves as the first support, and the next hurdle is the 0.236 retracement at $66,484. A four-hour close above it would be the first sign that the run of lower highs since early November is breaking.
Above that, the 0.382 level sits at $69,258, while the 50-period EMA at $71,151 lies just under the 0.5 retracement at $71,500, so those two levels overlap and form the main ceiling for any recovery this week. The 200-period EMA at $76,682 stays far above price and keeps the broader trend pointed down.
The RSI climbed to 32.39 after several sessions below 30, which means selling has eased enough that the market no longer looks stretched to the downside, although any reading under 50 still leaves sellers in control of momentum. It also crossed above its own average at 22.67, the earliest signal on this chart that short-term momentum is turning.
- Resistance: $66,484, then the $69,258 to $71,500 zone
- Support: $64,242, then $62,000
Monday’s ETF Data Will Test the Rebound
The weekend recovery happened without any ETF participation, so the flow figures for November 16 will show whether IBIT’s redemption streak extends to a 12th session. A pause in outflows would remove the main source of weekday spot supply that has weighed on price since late October, while another day of $200 million-plus redemptions would put the $64,242 support under pressure again during U.S. trading hours.
The liquidation wave also reset derivatives positioning. With $1.68 billion in longs closed out, much of the leverage that fueled the cascade has left the market, which typically reduces the risk of a repeat flush at similar levels in the short term and shifts the focus to spot selling, where ETF flows show up first.
IBIT has gathered $64.19 billion in net inflows since its January 2024 launch, so the $2.35 billion withdrawn over the past 11 sessions equals about 3.7% of that total. The ETF group as a whole still holds $54.7 billion in cumulative net inflows, a figure that already absorbs the $28.1 billion Grayscale’s GBTC has lost since its conversion to an ETF.