- Bitcoin fell to a fresh November low after another leg of selling.
- Leveraged long positions took almost all of the day’s forced liquidations.
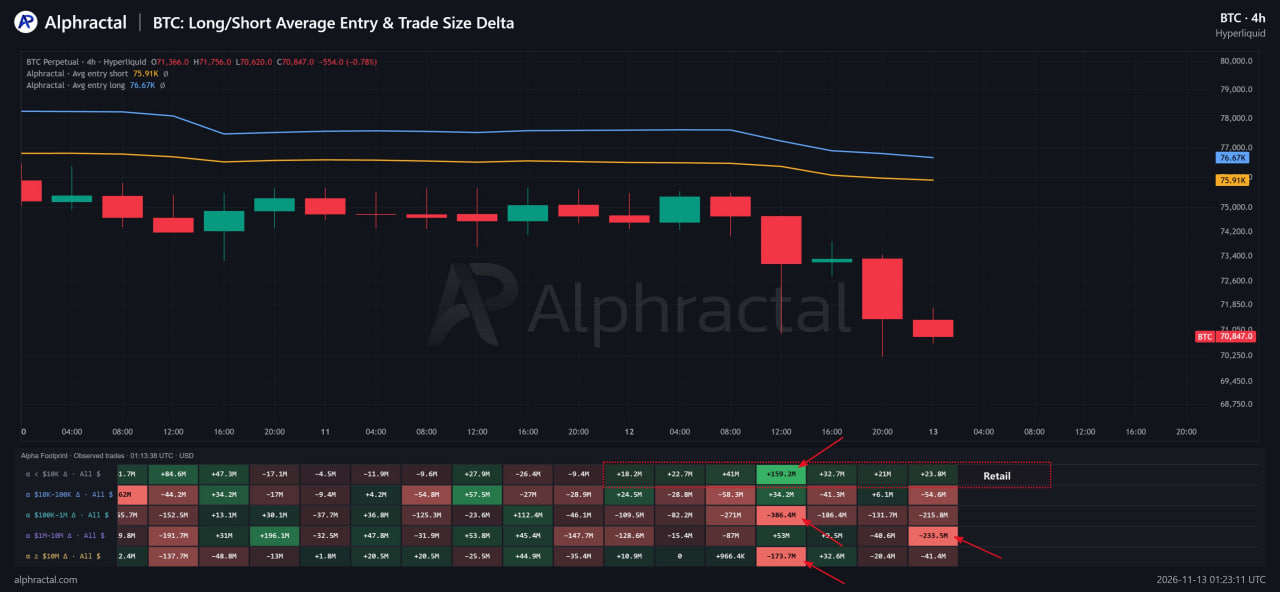
- Order-flow data shows small traders buying while large accounts sold.
- Ethereum and Solana lost more ground than Bitcoin over the week.
The Bitcoin price fell below $69,000 late on Thursday and into Friday, November 13, after a wave of selling in futures markets pushed it through several support levels in just a few hours. The selloff has now cut almost 9% from its price over the past week and forced out about $1.24 billion in leveraged long positions across crypto derivatives markets. At the time of writing, the largest cryptocurrency was trading near $68,750, down 6.7% in 24 hours according to CoinMarketCap. Its market capitalization has shrunk to $1.38 trillion, and the drop pulled the largest altcoins down with it.
The drop is the second leg of a decline that started when Bitcoin stalled near $80,500 on November 5 and sped up on November 10. That day, October inflation data came in above forecasts and pushed the odds of a December Fed rate hike to 98.8% on the CME FedWatch tool. This time, futures markets drove much of the selling, and volume on the breakdown candle rose well above the levels of the sessions before it.
Know when your
coins move
Longs Took Nearly 90% of the Liquidations
Data from CoinGlass shows $1.40 billion in positions liquidated over 24 hours. Of that, $1.24 billion came from traders betting on higher prices, against just $153.54 million from short sellers. Bitcoin contracts alone accounted for $738.78 million, with longs making up 96.4% of that figure. Ether came next with $248.19 million, 90.6% of it from longs, and Solana added $52.07 million.
A liquidation happens when a trader who borrowed to enlarge a position no longer has enough collateral to cover the losses. At that point the exchange closes the position automatically. For a long position, that means a market sell order that goes through at whatever price is available. When thousands of these orders trigger in the same price range, each wave of forced selling pushes Bitcoin into the next group of stop levels. That is how the four-hour candle that broke $71,450 ran all the way down to $68,500 before buyers stepped in.
The CoinGlass heatmap also shows liquidations on perpetual contracts tied to Nvidia shares and gold, which several crypto derivatives venues now list. Nvidia contracts alone lost $14.33 million. This suggests the deleveraging also hit traders who use crypto platforms to bet on traditional assets.
Small Wallets Bought, Large Accounts Sold
Order-flow data published by Joao Wedson, founder and CEO of analytics firm Alphractal, shows who was on the other side of those liquidated longs.Wedson broke down trades by size across 18 exchanges. Orders under $10,000 leaned toward longs, while trades in the $1 million to $10 million range and above $10 million were mostly short.
In practice, larger players sold or shorted into the decline while smaller traders tried to catch the bottom, often with borrowed money. Those late longs are the positions behind the liquidation totals above. The data does not show where the low will form. It does show that the buying so far has come from the accounts least able to absorb further losses.
Ethereum and Solana Fell Harder Than Bitcoin
Altcoins followed the slump, and over seven days the two largest smart-contract platforms fell well behind Bitcoin. Ether dropped to $1,926.94, down 6.05% on the day and 13.5% on the week, which leaves it below the round $2,000 mark. Solana fell to $78.18 after a 12.38% weekly decline. $BNB stayed closer to Bitcoin’s pace, down 8.59% over the same period.
Source: CoinMarketCap, November 13, 2026.
Altcoins usually fall further in a deleveraging because fewer buy orders sit near the current price, so the same amount of forced selling pushes their prices down further.
Bitcoin Tests the $68,500 Floor
On the four-hour chart, Bitcoin has made lower highs and lower lows since the $80,500 peak. Traders map pullbacks with Fibonacci retracement levels, measured here from that high to the latest low. Within two days the price broke through $73,275 and then $71,450, and both levels now sit overhead as resistance.
Bitcoin also trades well below its 50-period exponential moving average at $74,431 and its 200-period average at $78,093, and both lines point down. The 200-period line tracks the average price over roughly the past month. The gap between it and the current price is close to $9,000, or about 13%, which shows how fast the selloff has moved.
The Relative Strength Index (RSI) has dropped to 22.86. A reading under 30 means sellers have controlled the last 14 four-hour candles, about two and a half days of trading, to an unusually one-sided degree. Bounces often start from these conditions, but in strong downtrends the reading can stay low for days. The latest candle opened at $68,639 and has moved up to around $69,105. That small green bar sits next to a much larger red one, so buyers have defended $68,500 for now without turning the trend.
Whale Shorts Could Fuel a Squeeze Above $70,000
A four-hour close below $68,500 would bring the next Fibonacci extension at $65,550 into view, about 4% below that floor. On the upside, the first obstacle is $69,975, followed by $71,450, which held as support until Thursday. Above that, Bitcoin would need to win back $73,275 and the zone between $74,400 and $74,750 before the four-hour structure stops pointing lower. That zone is where the 50-period average meets the 0.5 retracement.
The liquidation flush has wiped out much of the leveraged long exposure built up in the first half of November. If prices keep falling, there is now less forced selling left to speed up the decline. The Alphractal data points the other way. If the price recovers, large accounts holding short positions may rush to close them, and that buying can add pressure on any move back above $70,000. For Ether, a return above $2,000 is the first level traders will watch to judge whether the altcoin market is stabilizing.
The $69,000 area matters beyond the four-hour chart. Bitcoin set its November 2021 all-time high near that price, and the level has been a reference point in several drawdowns since, which is one reason buy orders tend to gather around it. Sunday’s weekly close will show whether Bitcoin can end the week above its previous cycle peak or settles below it.