Technical Analysis Outlook for Bitcoin Price
Over the next 90 days, Bitcoin’s direction is likely to depend on whether the $62,500 support zone holds and whether the price can recover the $70,600 level it lost in mid-November 2026.
Trend & Momentum: Bitcoin traded near $63,300 on 19 November 2026, well below both moving averages on the daily chart, around $75,300 and $75,700 and turning lower. The 14-day RSI was near 23, deep in oversold territory, while the MACD line (about -4,310) stayed below its signal line (about -3,400), so downward momentum had not yet faded.
Chart Structure: Bitcoin broke below the rising trendline from the July low and the $70,600 support in mid-November 2026, and closed below its 200-week moving average near $67,900. The sell-off stopped at the $62,500 support zone, which was tested again on 19 November with a low near $62,300. A daily close below it would expose the July low near $58,000 and then about $53,400.
Volume Analysis: Liquidity was thin during the sell-off. Market depth within 1% of the price fell to about $72mn on 9 November 2026, roughly a third below normal, according to Talos. Thin order books tend to exaggerate price moves, so a break of either support or resistance could be sharp.
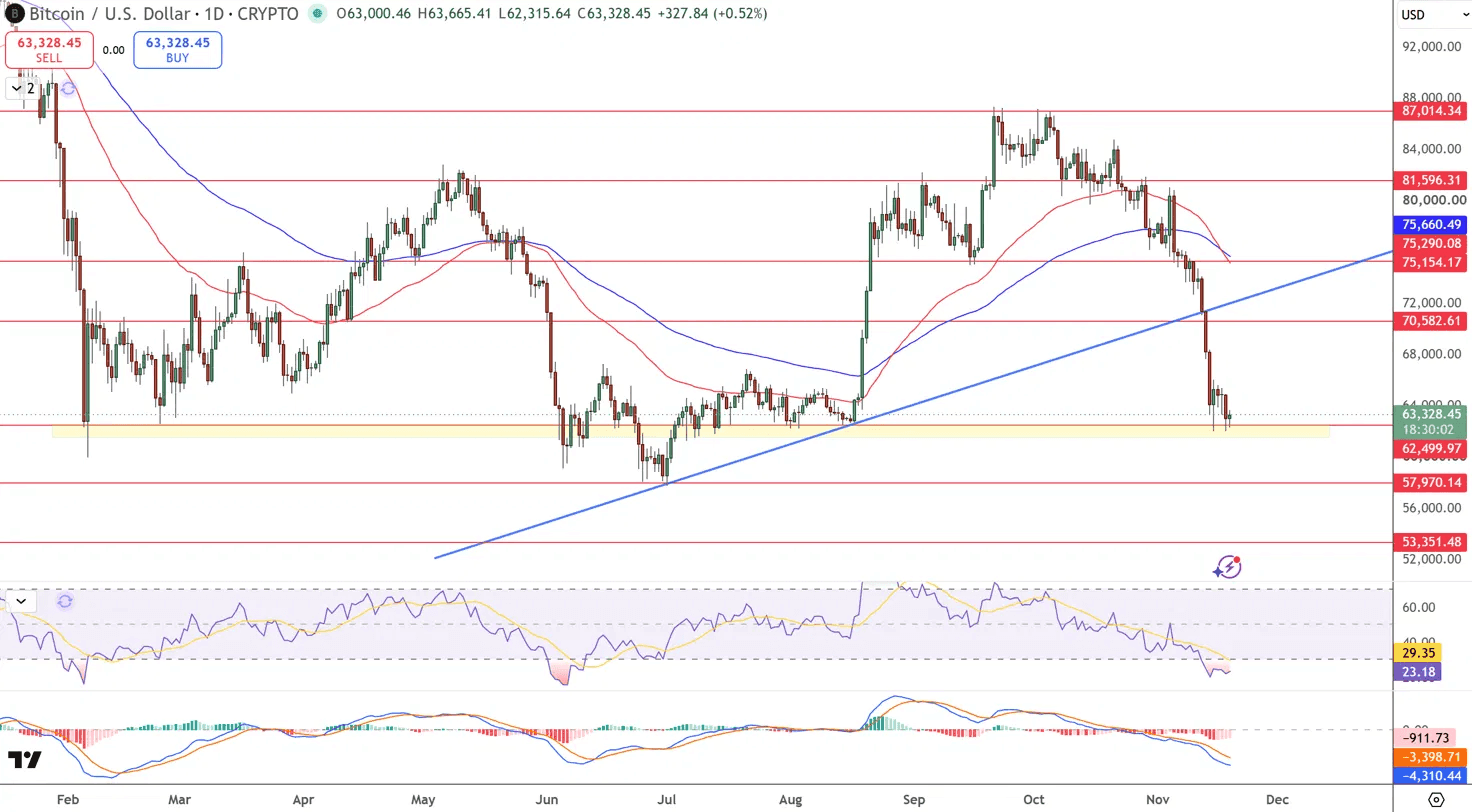
Figure: Bitcoin daily chart with moving averages, RSI and MACD, 19 November 2026. Source: TradingView.
Fear & Greed Index: The Crypto Fear & Greed Index fell to 10, or “Extreme Fear”, on 16 November 2026 and was still at 11 on 18 November, its lowest readings since June, showing that retail sentiment had turned sharply negative.
Derivatives Market: More than $1.3bn of crypto futures positions were liquidated in the 24 hours to 13 November 2026, including about $677mn of Bitcoin positions, according to CoinGlass. Liquidations eased in the following days, which suggests much of the excess leverage was cleared, but another break of support could trigger a fresh wave.
ETF Flows: US spot Bitcoin ETFs turned net negative for 2026, with outflows of about $1.56bn for the year as of 13 November (SoSoValue). After a small inflow on 16 November, outflows resumed on 17 November at about $240mn (Farside), so a steady return of inflows is still needed for a lasting recovery.
Key Levels to Watch
Primary resistance: $70,600. This was the support that gave way in mid-November, close to where the broken trendline now sits. A daily close back above it would ease the selling pressure and strengthen the recovery case.
Immediate support: $62,500. This zone has held several times in 2026 and sits inside the $62,000–$66,000 cost-basis band identified by Glassnode, where buyers accumulated about 66,000 BTC during two days of heavy selling in mid-November.
Critical support: around $58,000. This was the July 2026 low. A decisive break below it would increase the risk of a decline towards $53,400, near the realized price of about $53,700.
Next resistance: $75,150–$75,700. This zone combines horizontal resistance with both moving averages and sits close to the short-term holder cost basis (Glassnode), so recent buyers selling at break-even could add pressure there. Above it, $81,600 and the September high near $87,000 are the next barriers.
Short-Term Probability Table
The next 90 days can be framed around three scenarios based on Bitcoin’s technical structure, institutional flows and on-chain signals.
Note: Probabilities are scenario estimates based on the technical, institutional and on-chain signals discussed above; they are not published institutional forecasts.