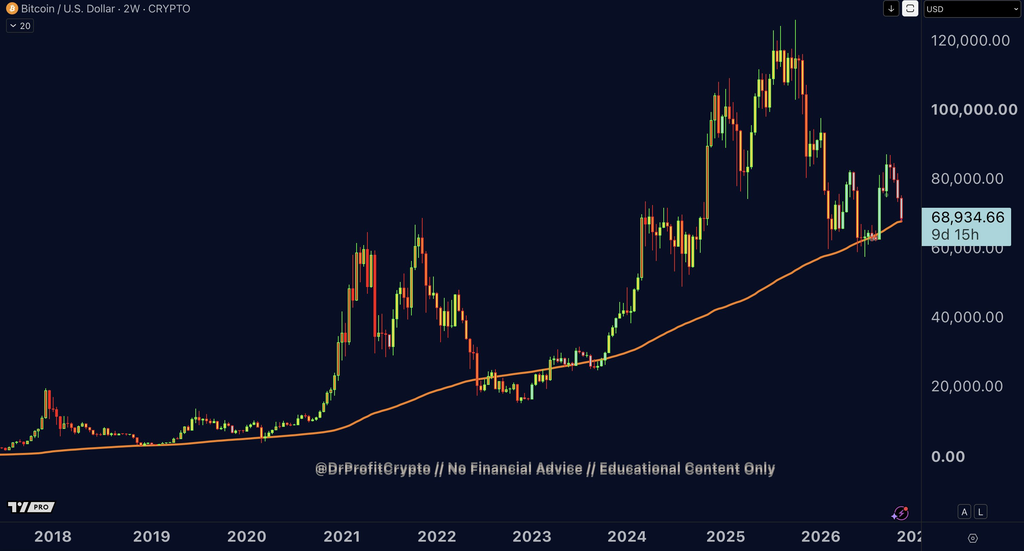
Bitcoin has fallen all the way back to one of the most watched long-term levels on its chart, and Doctor Profit believes the selloff may have finally reached its floor.
BTC traded around $68,000 on November 13 after another violent leg lower, putting price almost directly on the 200-week moving average.
Doctor Profit says that is enough for him to start bidding heavily.
His reasoning is based on a simple historical observation: Bitcoin has repeatedly formed major bear-market lows at or below this long-term average.
What you'll learn 👉
Bitcoin Is Almost Exactly on the 200-Week MA
Current estimates place Bitcoin’s 200-week moving average around $67,800-$68,000. BTC has been trading only a fraction above that level.
The indicator averages roughly four years of price history, so it moves far more slowly than short-term moving averages.
That is why traders often treat it as a measure of Bitcoin’s long-term cost basis and cycle structure rather than an ordinary support line.
Doctor Profit argues that the $68K test marks the bottom of the current correction.
His chart shows price meeting the rising average almost perfectly after falling from above $120,000.
The Historical Record Is Strong, But Not Perfect
The 200-week MA has played an important role in several Bitcoin downturns.
Bitcoin formed major lows around or below the line during 2015, 2018-2019, the March 2020 crash and the 2022 bear market.
But saying it has marked every bottom “perfectly” overstates the record.
Bitcoin has spent meaningful periods below the moving average.
During the 2022 bear market, for example, price fell as low as roughly 0.66 times the 200-week MA. Bitcoin also traded beneath it again during parts of 2023 and for more than two months earlier in 2026.
That means $68,000 is historically important, but it is not an unbreakable floor.
Read also: Bitcoin Price Crash Hasn’t Changed This Analyst’s Bullish Outlook
Why This Test Matters More Than a Normal Support Level
The interesting part of the current setup is how stretched Bitcoin has become.
BTC is now more than 40% below its 2025 peak, yet the 200-week average itself is still rising.
That creates a very different setup from buying into a short-term dip near record highs.
At roughly $68,000, Bitcoin is trading at almost exactly 1.0 times the long-term average. Historically, BTC has spent relatively little time this close to or below it.
Doctor Profit sees that asymmetry as attractive enough to add significant spot exposure.
$68K Still Needs to Prove It Can Hold
The market has not confirmed his call yet.
Bitcoin briefly slipped below the 200-week average during Friday’s selloff, and some analysts are already watching deeper support around $57,000-$60,000 if the level fails.
The first bullish signal would be a recovery above roughly $70,000-$71,000.
That would show buyers are responding to the long-term average rather than allowing price to establish itself underneath it.
If BTC instead spends several days below $68,000, the historical precedent from 2022 becomes much more relevant.
Doctor Profit is calling $68K the bottom.
History says the area is important.
But it also says Bitcoin can trade below the 200-week average before the real bottom is finally established.
For more crypto news and price predictions, click here.
Subscribe to our YouTube channel for daily crypto updates, market insights, and expert analysis.