Key takeaways
BTC trades near $55,960, down 9.51% in 24 hours.
Price is at its lowest level since September 2024.
Liquidations hit $1.00 billion, with 94% from longs.
Fed hike odds for December 9 sit at 88.6%.
The Fear and Greed Index reads 11, or Extreme Fear.
BTC trades near $55,960, down 9.51% in 24 hours.
Price is at its lowest level since September 2024.
Liquidations hit $1.00 billion, with 94% from longs.
Fed hike odds for December 9 sit at 88.6%.
The Fear and Greed Index reads 11, or Extreme Fear.
Bitcoin fell below $57,000 on Friday, its weakest level in more than two years. At the time of writing, BTC trades near $55,960.
The drop wipes out all gains made since Donald Trump won the 2024 election. It also leaves the coin 55.7% below its record high of $126,198.
BTC Price Forecast: Market Snapshot
Metric
Latest Data
BTC price
$55,960
24-hour change
-9.51%
24-hour range
$55,754 to $62,320
Market cap
$1.13 trillion
All-time high
$126,198 (-55.7%)
Futures volume (24h)
$111.97 billion (+36.81%)
Open interest
$37.26 billion (-10.44%)
Funding rate
-0.0058%
24-hour liquidations
$1.00 billion
Fear and Greed Index
11 (Extreme Fear)
Why BTC Is Falling: Yields, Fed and a Wider Sell-Off
This is not only a crypto story. The Nasdaq dropped more than 4% on Friday, its lowest level since April. Gold fell to its weakest point since September 2025.
Analysts point to rising real yields. When safe government bonds pay more, assets that pay nothing, like BTC and gold, look less attractive.
The Fed adds to the pressure. The CME FedWatch Tool shows an 88.6% chance of a hike on December 9. That would move the target rate from 375-400 to 400-425 basis points.
One month ago, that hike chance stood at 76.3%. A rate cut is priced at 0%.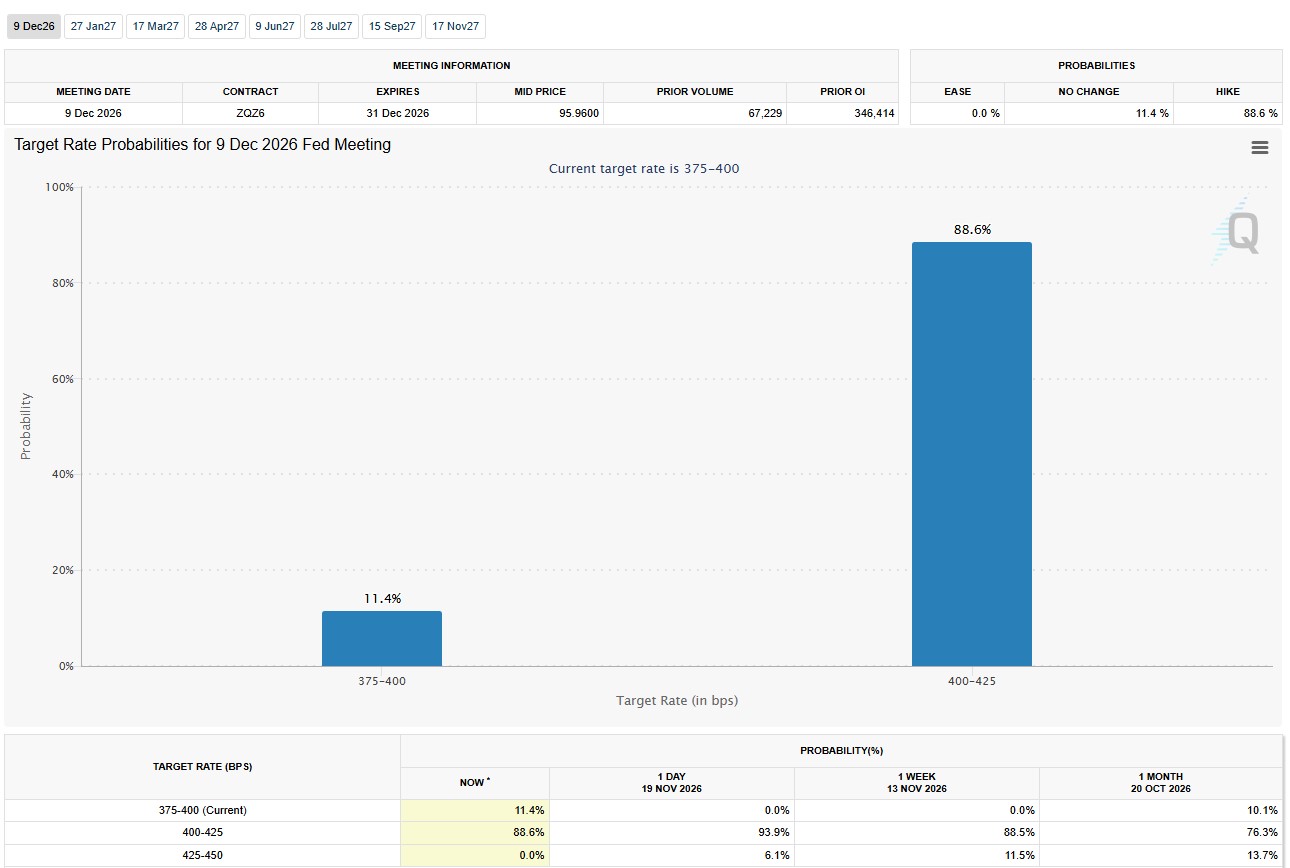
Arthur Hayes offered one reason Bitcoin gets sold first. Crypto trades around the clock, so investors with losses elsewhere often sell it to meet margin calls. Hayes has a mixed record on predictions, so his view is best read as a framework, not a target.
BTC Price Forecast: Longs Take the Hit in Futures
Derivatives data shows how fast things moved. Total liquidations reached $1.00 billion in 24 hours. Longs made up $943.50 million, while shorts were only $60.56 million.
Open interest fell 10.44% to $37.26 billion. That suggests traders are closing positions, not adding new ones.
The funding rate turned negative at -0.0058%. Shorts are now paying longs, which points to bearish positioning.
Volume tells another side. Futures volume rose 36.81%, so traders are busy even as price drops.
Spot ETF Flows Stay Weak
US spot ETFs recorded a net outflow of $124.43 million on November 20. Fidelity's FBTC led with $72.38 million in exits. Grayscale's GBTC followed with $32.84 million.
Total net assets sit at $74.72 billion, or 2.29% of the market cap. Cumulative net inflows remain positive at $53.39 billion.
Some issuers had not yet reported, so these numbers are preliminary. Reports also cite more than $3 billion in year-to-date Bitcoin ETF outflows.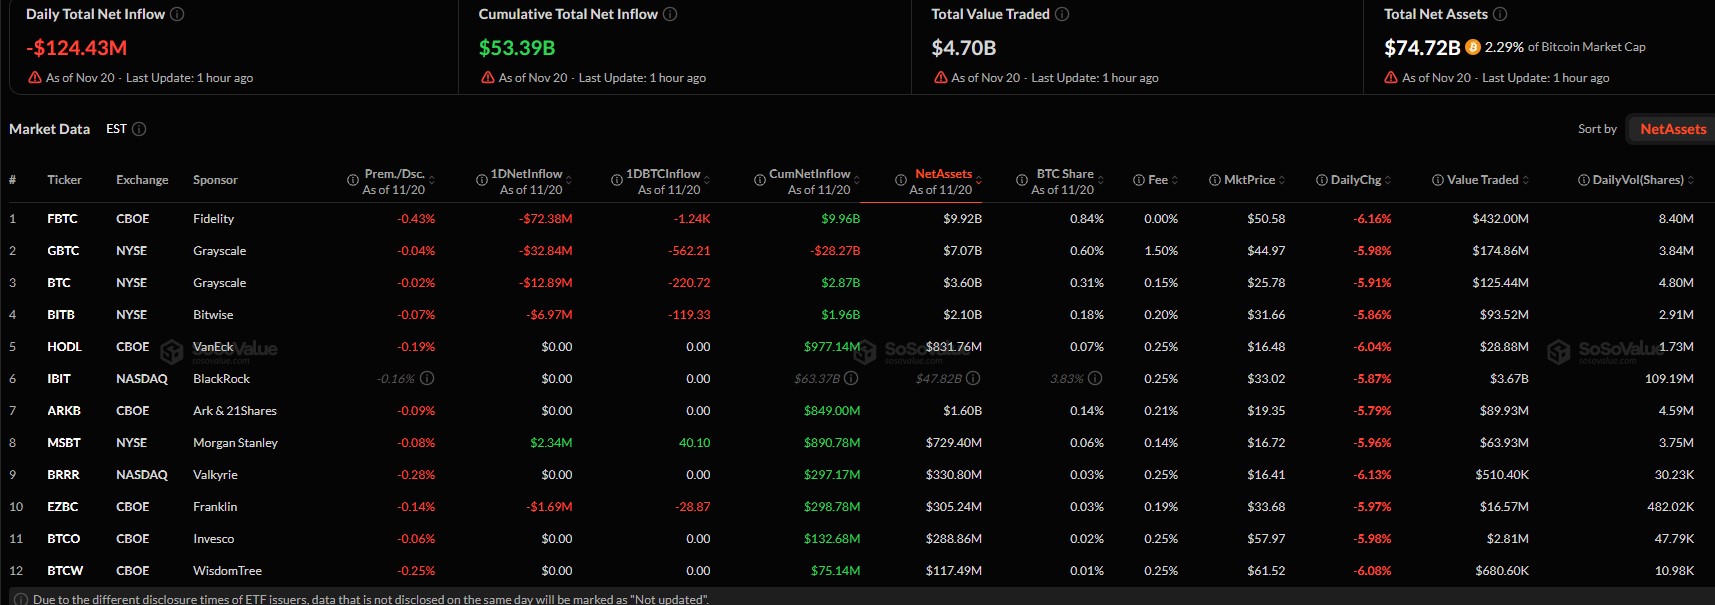
Sentiment Sinks as Big Voices Warn Caution
Santiment says the bullish-to-bearish comment ratio fell to 0.59. Bearish comments now clearly outnumber bullish ones. That is an Extreme Fear zone.
Santiment adds that fear alone does not prove a bottom. Price would need to stabilize first.
Robert Kiyosaki urged readers not to "catch a falling knife." He says he began buying BTC at $20,000 after the last crash and will wait for a new bottom.
Peter Schiff took a harsher view. He expects a bigger financial crisis than 2008 and thinks the Fed may choose higher inflation over a crash.
Not everyone agrees with that view. Those are opinions, not facts.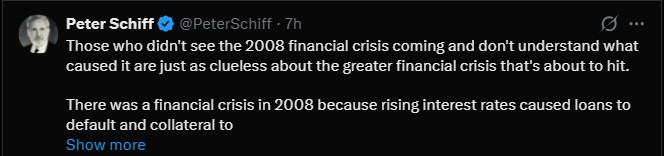
BTC Technical Outlook: Trendline Breaks on the Weekly Chart
The weekly chart looks heavy. BTC has slipped below the 20, 50, 100 and 200 EMAs. It has also broken the long-term rising trendline near 60,000-62,000.
This week's candle opened at $65,310 and is down 14.33% so far. A weekly close below the trendline would confirm the break.
The total crypto market cap has also lost its 300-week moving average for the first time ever. Analysts call that a major warning sign.
Key levels to watch
Level
Price (USD)
Why It Matters
Resistance 3
78,142
100-week EMA
Resistance 2
69,556 to 73,677
200-week and 20-week EMAs
Resistance 1
60,000 to 62,000
Broken trendline
Support 1
57,803
Prior swing low, near technical support
Support 2
52,000 to 55,000
Next downside zone if the break holds
Support 3
48,000 to 50,000
Psychological support
The Factor Report's chart marks $57,803 as a key line. It says the area below that level "gets very dicey."
Bitcoin Price Prediction: The Math Behind a 75% Drop
Veteran commodity trader Peter Brandt says Bitcoin may be early in a much deeper sell-off. He argues every bull phase in BTC's history ended with a correction of at least 75%.
At the time of posting this tweet, BTC traded near $62,000 on Nov. 20, about 51% below its October 2025 record. The weekly candle on his chart showed $62,110.99, down 4.91%, before the latest slide.
Brandt did not give a price target. He posted a question instead, asking if this is what is happening.
Past cycles back his point. BTC fell about 84% from its December 2017 high to its December 2018 low. It lost around 77% after its November 2021 peak.
His chart marks a 70% correction at $37,629. That uses an implied peak near $125,430. Applying 75% to the same peak gives $31,358.
That second figure is a calculation, not a Brandt target. Here is how both levels compare with two starting prices:
Level Price (USD) Drop From $62,110.99 Drop From $55,960
70% correction (marked on Brandt's chart) 37,629 about 39.4% about 32.8%
75% correction (calculated, not a Brandt target) 31,358 about 49.5% about 44.0%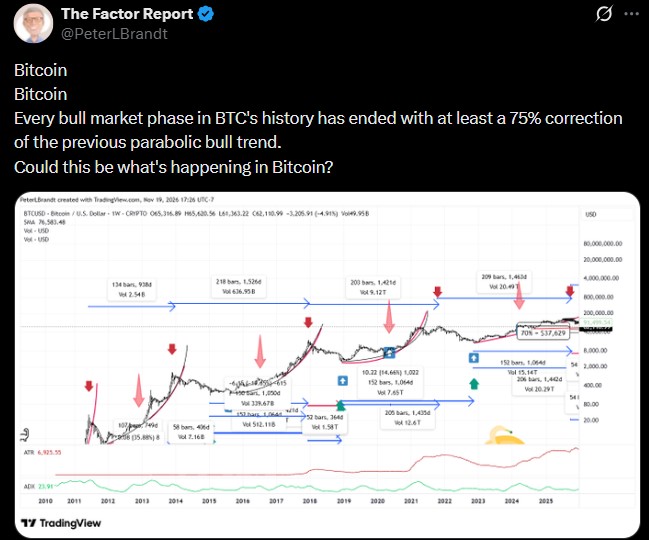
Head-and-Shoulders Setup Draws Attention
On Nov. 15, Peter Brandt shared a weekly chart showing a possible head-and-shoulders pattern. Traders often read that shape as bearish. He marked $60,000 to $65,000 as a key zone.
BTC has now slipped below that zone. The weekly trendline break near $60,000 to $62,000 adds to the concern.
He also said log scale is needed to measure the target. On a linear scale, the target turns negative.
If the pattern is confirmed, Brandt said, the coin may never revisit its record high in his lifetime. That is an opinion, and charts can fail.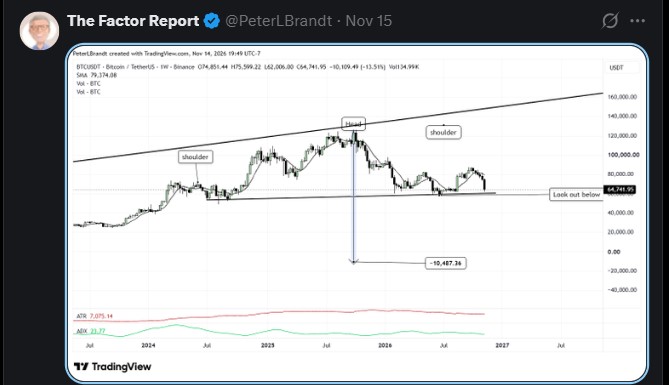
What Could Happen Next
The bearish case is simple. If BTC closes the week below the trendline, sellers may aim for $52,000-$55,000. A slide toward $48,000-$50,000 would then be on the table.
Rising yields and a likely Fed hike could keep pressure on risk assets. Another weak day for tech stocks would not help.
The bullish case needs a reclaim. If buyers push BTC back above $60,000-$62,000, a bounce toward $69,556-$73,677 is possible.
That would still be a relief move inside a larger downtrend, unless price also wins back the moving averages.
Nobody knows how this ends. Extreme Fear has marked lows before, but it has also appeared in the middle of falls. The next few days of price action will say more than any single indicator.
Disclaimer
This article is for information only and is not financial, investment or trading advice. Cryptocurrency prices are highly volatile, and you can lose some or all of your money. Price levels mentioned are possible scenarios, not guarantees. Always do your own research and speak with a licensed financial adviser before making decisions.
About the Author Lokesh Gupta
Research Analyst at coingabbar.com
Lokesh Gupta started his journey in financial markets 23 years ago and never looked back. From Forex to Comex, NSE, MCX, NCDEX, and now Crypto — he has seen it all. He holds an MBA in Finance and over the last 4 years, Bitcoin, Ethereum, Solana, XRP, and trending coins have become his main focus. People who follow his work say one thing — he keeps it real. No fancy language, no unnecessary complexity. Just honest market research that helps you understand what is happening and why it matters to your money.
 November 20, 2026
November 19, 2026
November 18, 2026
November 17, 2026
November 17, 2026
November 16, 2026
November 14, 2026
November 14, 2026
November 9, 2026
Frequently Asked Questions (FAQ)