Is a 28% monthly slide already priced into ADA, or are sellers just warming up?
This Cardano price prediction leans bearish while the price stays under $0.1919, a pattern also covered in the prior channel analysis.
The ADA price today reads $0.1874 on CoinMarketCap and $0.1889 on Binance, now sitting in the lower half of a falling lane.
ADA Market Snapshot at 04:52 UTC
At 04:52 UTC on Nov 4, 2026, Cardano trades at $0.1874, down 0.4% in 24 hours, per CoinMarketCap data. It ranks 15th at $6.9B.
Volume rose 8.97% to $223.27M while price slipped, which usually means, sellers haven't left.
Circulating supply is 36.82B ADA of a 45B cap, with a fully diluted value at $8.43B. And the 2021 peak of $3.10 still sits 93.97% overhead.
Coinglass shows 8.73% lost in a week, 27.56% in a month, and 43.58% year to date.
Why ADA Price Today Lags a Bitcoin Bounce
Bitcoin trades at $77,692.30, up 1.47%, while ADA slipped 0.4%.
Total crypto market cap rose 1.07% to $2.59T. Fear and Greed reads 36, and Altcoin Season sits at 47.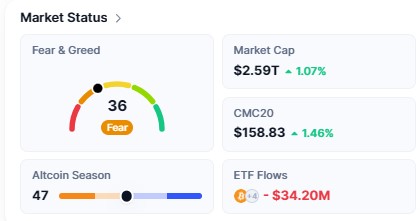
ETF flows show $34.20M leaving, small yet pointed the wrong way.
And a coin that can't rise on a green Bitcoin day usually has sellers waiting overhead. A wider view sits in the November Cardano outlook.
Cardano Technical Analysis as a Price Walk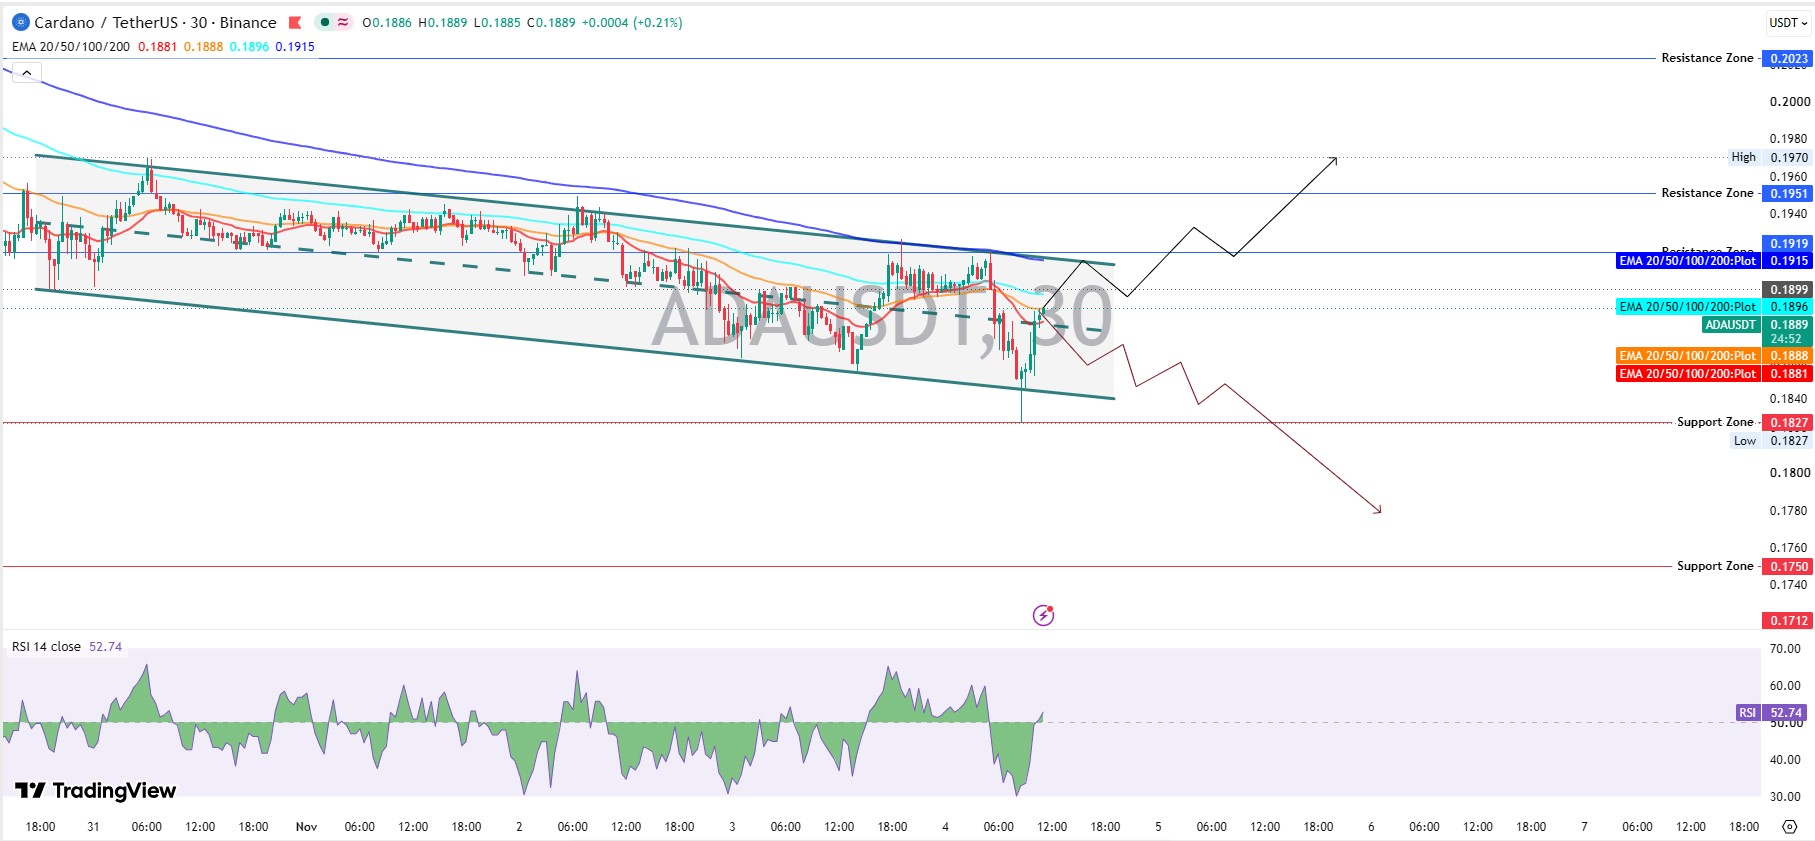
A price walking down a staircase, bumping its head on a slanted ceiling each time it climbs.
On the 30-minute TradingView chart, that ceiling and its matching floor form a descending channel, a pair of falling parallel lines that cap rallies and guide dips.
The price slid to the floor and wicked to $0.1827 on Binance. Buyers dragged it straight back.
From there it climbed through the 20 EMA and 50 EMA (exponential moving averages, which weigh recent trades more) at $0.1881 and $0.1888. Now it's pressing the 100 EMA at $0.1896.
RSI reads 52.74. Barely above the midline, so momentum is neutral, not bullish.
Overhead, the 200 EMA at $0.1915 sits almost on top of the channel roof. That's the wall.
This Cardano technical analysis walk turns higher only above that wall.
Cardano Support and Resistance Levels
Support Below
Buyers defended $0.1827 so far. Under that sit $0.1750 and then $0.1712.
Resistance Above
Buyers face $0.1899, then $0.1919, where the 200 EMA waits. Beyond sitting at $0.1951 level and $0.2023 level, a 100 EMA reclaim has to come first.
Price sits about 3.3% from either edge, so Cardano support and resistance here are tight.
Liquidations Hit Longs First
Longs got hit. Liquidations, the forced exits of leveraged trades, reached $857.57K in 24 hours, and $757.51K of that was long positions.
Fast, too. $500.02K of longs vanished in the past 4 hours.
The latest hour wiped only shorts, $15.46K worth.
Spot flows hint at buyers testing the dip, with a net inflow of $87.40K over 15 minutes and $54.93K over 30 minutes, per Coinglass liquidation data.
Futures Crowd Still Leans Long
Futures volume reached $354.35M against $46.69M in spot. Open interest, the total value of live futures contracts, sits at $416.17M.
Binance accounts show a long/short ratio of 1.9308, and OKX shows 2.69.
Crowded longs unwind fast, as the earlier long flush retest showed. And when they do, price usually slides until. Bids show up near the next floor.
So who buys when the next dip hits?
Staking Holds Supply While Network Activity Fades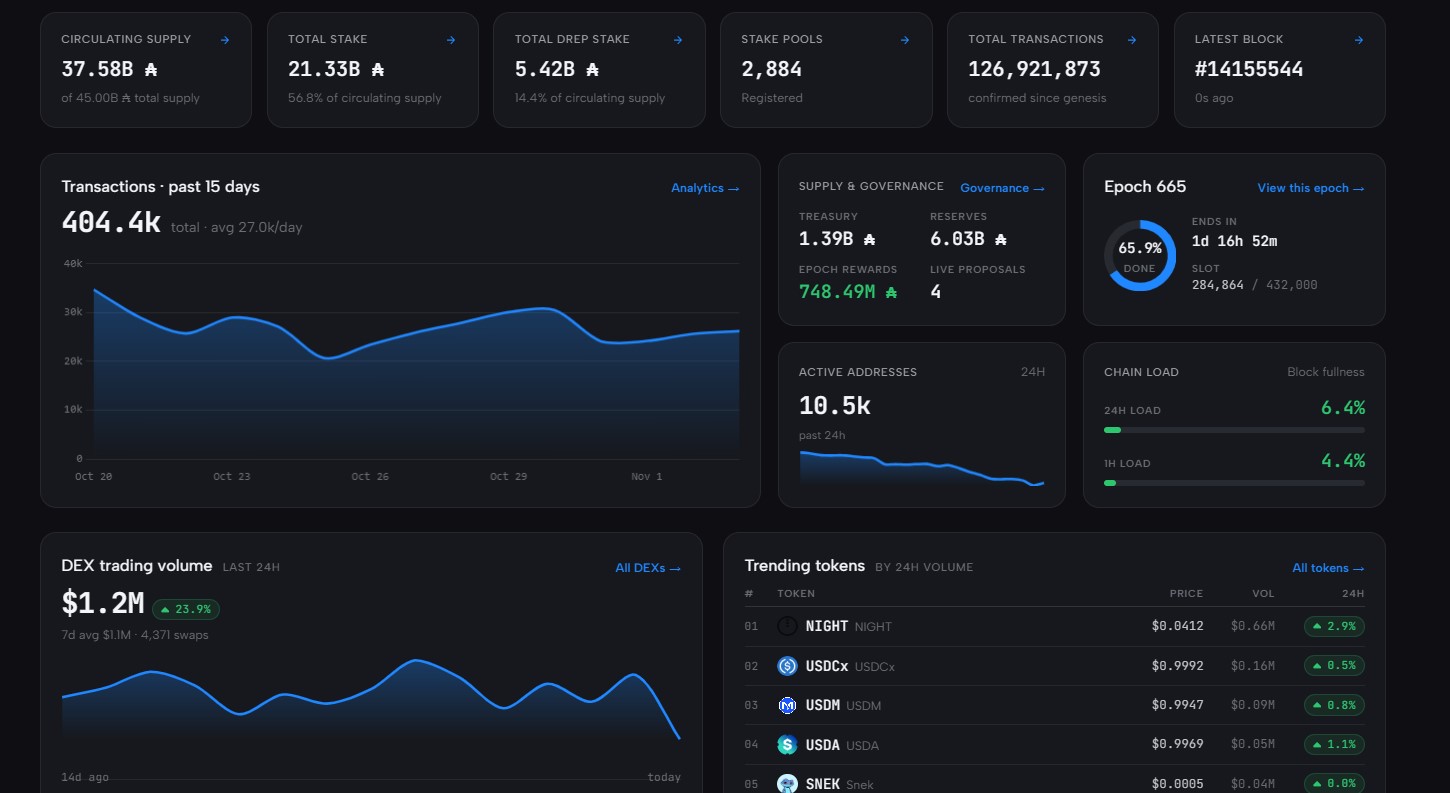
Cardanoscan network stats show 21.33B ADA in staking, which is 56.8% of circulating supply, spread across 2,884 pools.
But activity is thin. Active addresses sit at 10.5k over 24 hours and keep sliding. DEX volume is $1.2M, up 23.9%, though that's only. A little above the 7-day average of $1.1M.
Epoch 665 ends at 21:44 UTC on Nov 5, 2026.
Can ADA Hold $0.1827 After the 28% Slide?
Probably, on the first retest. Buyers already defended $0.1827 once, RSI is back at 52.74, and spot flows are positive.
But a 28% monthly slide leaves a thin cushion. With the long/short ratio at 1.9308 and active addresses sliding to 10.5k, a second push at the floor meets fewer buyers.
A retest on volume above $223.27M is the warning sign.
Weak longs have already left through $757.51K in liquidations, which helps the floor.
Can ADA Reach $0.2023? Reward and Risk Math
From $0.1889, $0.1919 sits 1.6% higher, $0.1951 sits 3.3% higher, and $0.2023 sits 7.1% higher.
Downside runs 3.3% to $0.1827 and 7.4% to $0.1750. Almost symmetrical.
That's why this Cardano price prediction stays cautious. Recovering 7.1% would erase most of the 8.73% weekly loss, and the 200 EMA resistance hasn't given way.
Bearish felt right a minute ago. Actually, RSI above 50 and positive spot flows say sellers have lost some grip.
But a bounce inside a falling channel is only a bounce until the roof breaks. For the next 24 hours, range trade between $0.1827 and $0.1919 is the likeliest path.
Cardano Price Forecast Scenarios
Scenario
Trigger
Target
Invalidation
Liquidity Condition
Bull
Trades above $0.1919
$0.1951, then $0.2023
Back under $0.1881
Spot inflows grow, shorts squeezed
Base
Range between $0.1827 and $0.1919
$0.1889
Break of either edge
Volume stays near $223.27M
Bear
Trades below $0.1827
$0.1750, then $0.1712
Reclaim of $0.1899
Long liquidations stack, bids thin
Bull Case
In this Cardano price prediction, buyers need $0.1919 to hold on the 30-minute chart. Then $0.1951 and $0.2023 open up if daily volume climbs above $223.27M.
Base Case
Chop between $0.1827 and $0.1919 is the middle path for this ADA price prediction, with $0.1889 acting as the magnet.
Bear Case
Trading under $0.1827 sends the price toward $0.1750 and then $0.1712. This Cardano price forecast leans that way, since the channel still points down, a setup also tracked in the range breakout or breakdown study.
Risks That Could Flip the Cardano Price Prediction
A Bitcoin reversal from $77,692.30 hits altcoins first.
And ETF outflows of $34.20M, small today, could grow quickly if sentiment stays at 36.
Governance adds noise, with four live proposals still open, as the midline governance vote piece covered.
A break above $0.1919 voids the bear view. Whether buyers can hold $0.1827 once Epoch 665 rolls over is still open.
Disclaimer: This article is for information only and isn't financial advice. Crypto prices swing fast, and readers should do their own research before trading.
About the Author Aashish Vishwakarma
Technical Analyst at coingabbar.com
Aashish Vishwakarma is a crypto analyst, technical analyst, and content writer with 2+ years of experience in cryptocurrency research and financial markets. He covers crypto market analysis, price predictions, technical indicators, market trends, digital assets, and blockchain developments, delivering clear, data-driven insights through engaging content.
 November 3, 2026
November 3, 2026
November 3, 2026
November 2, 2026
November 2, 2026
November 2, 2026
October 30, 2026
October 29, 2026
Frequently Asked Questions (FAQ)