DRV jumped about 20% by 10:37 UTC on Nov 21, 2026, and now trades on its 100 EMA. This Derive price prediction tests whether the break holds, and the earlier Derive listing rally shows how fast a spike can fade.
Derive Price Prediction Starts With the Data Snapshot
CoinGecko DRV data lists $0.2974 after a 20.9% jump, with a $319.932M market cap and a 24-hour range of $0.2373 to $0.3062.
Volume, the value traded in a day, is $18.886M. That's 5.9% of market cap.
The price still trades 47.1% under the all-time high of $0.5693.
Derive Price Analysis From Wedge Low to Breakout Candle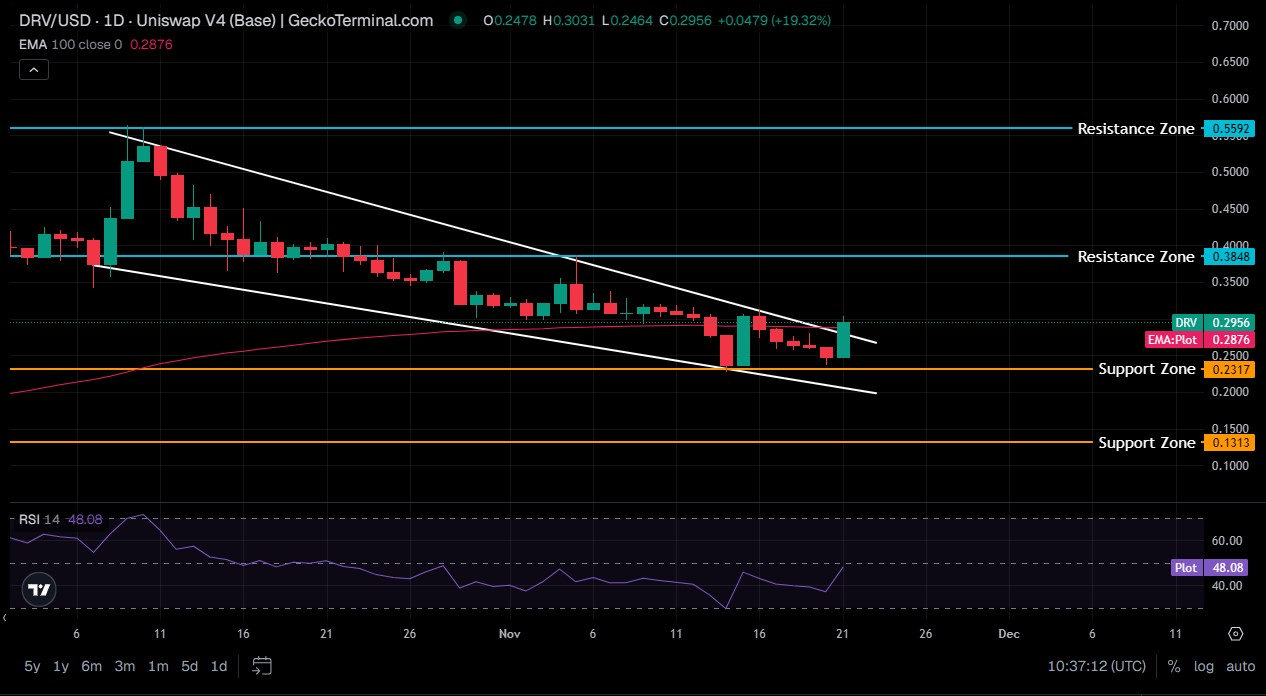
Daily candles on the GeckoTerminal DRV chart start around Oct 10, when buyers pushed the price to the $0.5592 level. That's resistance, a level where sellers keep showing up.
6 weeks of lower highs followed, and the lows crept down too. That shape is a falling wedge, 2 trendlines, and lines joining highs or lows, sloping down and squeezing together. Price tagged $0.2317 around Nov 14, and a tall green candle bounced off that level.
After a run of small red candles, the latest one opened at $0.2478, ran to $0.3031, and traded at $0.2956 by 10:37 UTC on Nov 21, 2026. It broke the upper wedge line and the 100 EMA at $0.2876 at once.
Call it a falling wedge breakout. RSI sits at 48.08. That's neutral.
DRV Support and Resistance on the Daily Chart
Support, a level where buyers tend to step in, starts at the 100 EMA at $0.2876, then $0.2317 and $0.1313.
Resistance sits at $0.3848 and $0.5592.
Why Is DRV Up Today? The RWA Options Backdrop
Nvidia options and perpetuals went live on Nov 16, timed for earnings. Then came the Derive CoinRoutes post on Nov 17. Desks trading tokenized equities and stocks issued as on-chain tokens can hedge with RWA options and options on real-world assets and settle on Ethereum.
Price drifted lower after both posts, so the news didn't start this move alone. But it gives buyers a reason to defend $0.2876.
Spot Buyers, Not Borrowed Money, Drove the Move
Perpetual futures open interest, the value of live contracts, is only $1.769M on CoinGecko. That's 0.55% of market cap, so borrowed money isn't behind this jump.
On the Base pool, buys beat sells 1,195 to 840 for a net buy of $234.45K. And the price rose 17.32% in the last 6 hours alone.
Pool liquidity, how easily tokens trade without moving price, is $2.5M. Fresh exchange listing updates would add depth.
Whale Concentration Is the Weak Spot
Etherscan holder data shows extreme whale concentration. The top 100 wallets hold 98.16% of supply on Ethereum, and the top wallet alone holds 36.97%.
Exchange and vesting wallets sit in that group, so not every large holder is a seller.
Another 438M DRV, 29.2% of total supply, isn't circulating yet. And what happens when a big wallet sells into a pool holding $2.5M of liquidity?
Derive Price Forecast Scenarios and Targets
This Derive price forecast leans bullish, while buyers hold $0.2876. A Derive price projection past $0.3848 needs spot volume first, and the crypto price predictions hub covers similar setups.
Scenario
Trigger
Target
Invalidation
Liquidity Condition
Bull
Daily trade above $0.3159, EMA held
$0.3848, then $0.5592
Trade under $0.2876
Volume above $18.886M
Base
A retest of $0.2876 holds
$0.2876 to $0.3159 range
Break of either edge
Volume near $18.9M
Bear
Trade under $0.2876, then $0.2317
$0.2317, then $0.1313
Reclaim of $0.3159
Volume fades, bids thin
Derive Price Outlook for the Week and Month
For the next 24 hours, the range is $0.2876 to $0.3062.
If the 100 EMA holds through the week, then $0.3159 gets tested.
Over a month, a daily trade above $0.3159 on volume above $18.886M opens the first DRV price target, $0.3848, which is 29.4% above $0.2974.
This Derive price outlook stops at 30 days, since the data backs no more. Derive settles on Ethereum, so the Ethereum price prediction is worth a glance.
Risks That Can Break the Derive Price Prediction
Volume is 5.9% of market cap; a single candle built this breakout.
But 98.16% top-100 ownership and 438M unreleased tokens matter more, since one large sale moves the chart.
Final Takeaway
Buyers hold the edge while $0.2876 stands. $0.3848 is the first real test, and a trade under $0.2317 ends the wedge breakout. Terms are explained in the crypto dictionary.
Disclaimer. This article is for information only and isn't financial advice. Crypto prices swing fast, and every level here can fail.
About the Author Aashish Vishwakarma
Technical Analyst at coingabbar.com
Aashish Vishwakarma is a crypto analyst, technical analyst, and content writer with 2+ years of experience in cryptocurrency research and financial markets. He covers crypto market analysis, price predictions, technical indicators, market trends, digital assets, and blockchain developments, delivering clear, data-driven insights through engaging content.
 6 hours ago
November 20, 2026
November 19, 2026
November 18, 2026
November 17, 2026
November 17, 2026
November 16, 2026
November 14, 2026
November 14, 2026
Frequently Asked Questions (FAQ)