Bitcoin.com News examined two distinct datasets to investigate the revival of long-dormant bitcoin holdings throughout 2026. The first is a tool called Btcparser 1, which monitors inactive bitcoin addresses and records their outgoing transactions, providing a detailed account of individual wallet movements, transaction sizes, and historical activity.
The second, the Bitcoin network analytics provider Checkonchain, tracks revived bitcoin supply according to when coins were acquired, offering a broader perspective on how much older supply has returned to circulation. Together, these sources reveal when dormant bitcoin moved, which generations of holders were most active, and how the activity compares with the larger pool of revived coins.
Btcparser Data Shows Nearly 34,000 $BTC Moved From Sleeping Bitcoin Wallets in 2026
According to Bitcoin.com News’ examination of Btcparser’s onchain records, dormant addresses established between 2010 and 2017 transferred approximately 33,932.19 $BTC, worth $2.49 billion today, across 873 recorded movements between January and October 2026. That translates into an average of roughly 112 $BTC daily, although activity varied considerably from one month to another.
Know when your
coins move
The movements unfolded in distinct waves, featuring enormous single-day transactions, coordinated wallet sweeps, and occasional appearances by coins that had remained untouched for more than 16 years. Some addresses transferred their entire balances within seconds of one another, while others displayed patterns suggesting carefully orchestrated movements by large holders.
According to this parsing tool’s specific data set, which monitors more than 60,000 sleeping legacy wallets, the first quarter recorded 8,837.55 $BTC across 217 transfers, followed by 9,824.29 $BTC during the second quarter. Activity intensified between July and September, when 312 transfers moved 13,111.20 $BTC, establishing the third quarter as the busiest period examined by our newsdesk.
As we reported previously, August was the standout month, producing 188 transfers totaling 6,427.59 $BTC, equivalent to approximately 214 $BTC daily. September followed with another 5,419.45 $BTC, while May ranked third with 5,073.71 $BTC.
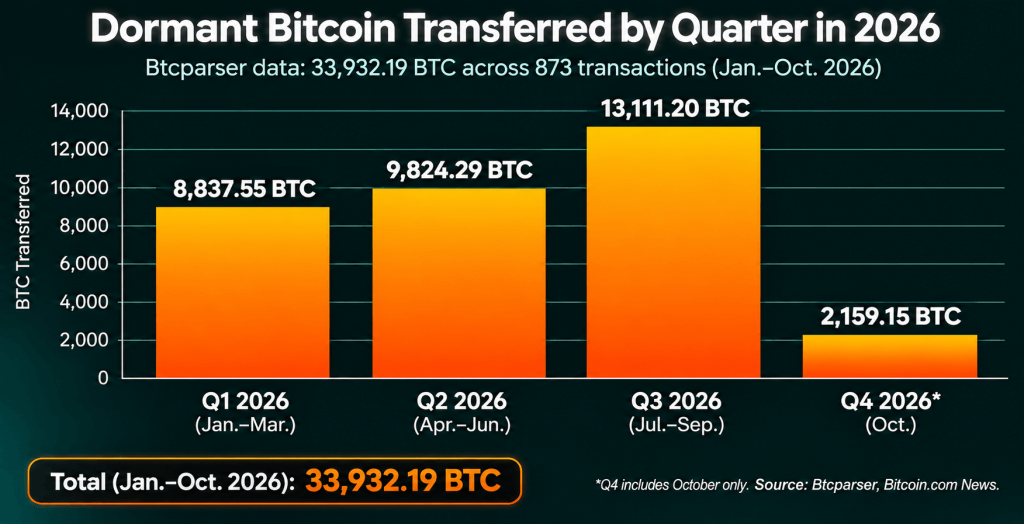
July, conversely, registered just 1,264.16 $BTC across 30 transfers, making it the quietest month. October subsequently recorded 2,159.15 $BTC across 35 movements, although its average transaction size reached 61.69 $BTC, the highest monthly average of the year.
The figures illustrate an interesting distinction: more wallet movements do not necessarily translate into greater bitcoin volume. Some periods featured numerous modest transfers, while others were dominated by a handful of exceptionally large holders moving substantial balances.
Satoshi-Era Bitcoin Awakens After More Than 16 Years
Perhaps the most fascinating developments involved bitcoin originating from 2010, when mining rewards were 50 $BTC per block and the network remained in its infancy. On Saturday, Jan. 10, a wave of 40 addresses created between July and December 2010 collectively moved 2,000 $BTC.
Each address contained approximately 50 $BTC, and the transactions appeared within block 931668, occurring roughly three seconds apart over a two-minute interval. The coordinated movement accounted for nearly all the 2,020 $BTC transferred that day, making Jan. 10 the largest single day for dormant bitcoin movements parsed by the blockchain tool in 2026.
Another extraordinary episode unfolded Saturday, Sept. 5, when addresses originating in March 2010 transferred their original 50 $BTC balances within an 11-minute window. September ultimately recorded 600 $BTC moving from 2010 wallets. Across the year so far til the end of October, legacy bitcoin addresses first created in 2010 transferred approximately 2,840 $BTC, while wallets created in 2011 contributed at least another 815.99 $BTC.
These movements are particularly interesting because their precise balances resemble original mining subsidies. However, the appearance of early block rewards does not establish that Satoshi Nakamoto controlled the addresses, nor does it identify their owners.
Moreover, none of the 2010 bitcoin movements documented in Bitcoin.com News reports have been linked to the Patoshi Pattern, the distinctive mining signature associated with pseudonymous Bitcoin creator Satoshi Nakamoto’s early mining activity.
Btcparser’s data also revealed unusual activity involving extremely small balances. Two 2010 wallets transferred just 0.00001093 $BTC each on Sept. 9, illustrating how dormant-wallet monitoring can capture both substantial movements and tiny transactions associated with previously inactive addresses.
The Mystery of Bitcoin’s Repeated 500 $BTC Transfers
Beyond ancient mining rewards, one of the year’s most intriguing patterns involved wallets established on Jan. 23, 2016.
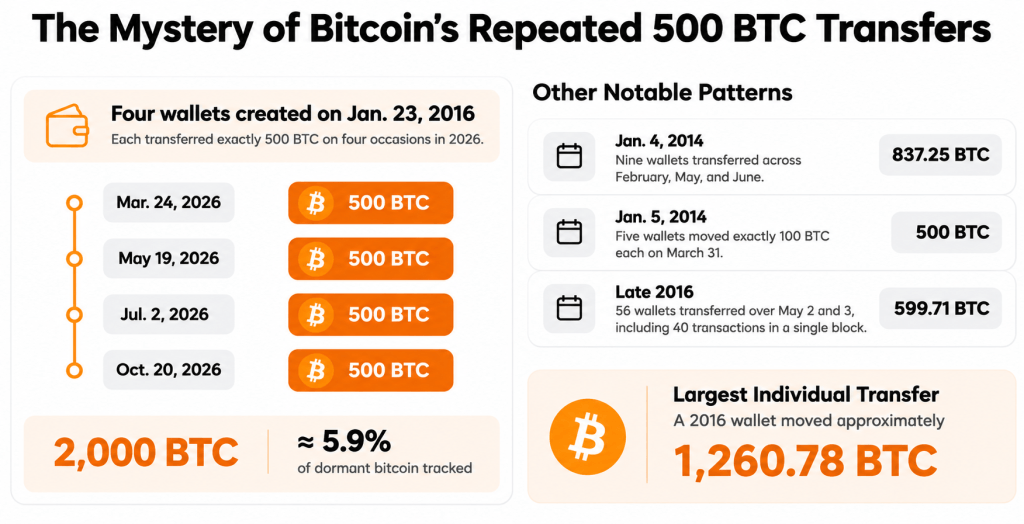
Four addresses created on Jan. 23, 2016, each transferred exactly 500 $BTC, with movements recorded on March 24, May 19, July 2, and Oct. 20, 2026. Together, those four transfers represented 2,000 $BTC, approximately 5.9% of all dormant bitcoin tracked during the examined period.
The spacing between transactions suggests a potentially deliberate distribution schedule. Nevertheless, common creation dates and identical balances cannot independently establish that the addresses belong to the same individual or institution.
Other patterns were equally conspicuous. Nine wallets created Jan. 4, 2014, collectively transferred 837.25 $BTC across February, May, and June. Another five wallets established the following day moved exactly 100 $BTC apiece on March 31. Combined, those two groups accounted for 1,337.25 $BTC.
Meanwhile, 61 addresses associated with a recurring 10 $BTC transfer pattern moved 610 $BTC during May and June. Another 56 wallets created in late 2016 transferred 599.71 $BTC over May 2 and 3, including 40 transactions recorded within a single block.
Such concentrated activity suggests unique types of wallet management, consolidation, or coordinated custody operations rather than hundreds of unrelated holders independently deciding to transact simultaneously.
The year’s largest individual transfer came in early September, when a wallet established in 2016 moved approximately 1,260.78 $BTC. That transaction was more than twice the size of the next-largest individual movement recorded.
Which Bitcoin Wallet Generations Moved the Most Coins?
Although Satoshi-era activity attracted considerable attention, wallets established several years later accounted for substantially more transferred bitcoin. Addresses originating in 2014 led the examined period with at least 8,134.20 $BTC, followed closely by 2016 wallets with 7,941.98 $BTC.
The 2013 cohort contributed 5,560.90 $BTC, while addresses established in 2017 moved at least 4,163.11 $BTC. Together, the 2014 and 2016 generations accounted for approximately 47% of the bitcoin tracked in the report. August was especially consequential for 2014 addresses. That cohort transferred 3,286.26 $BTC across 94 movements, accounting for more than half the month’s bitcoin volume.
The 2016 generation displayed greater consistency, recording more than 500 $BTC in every month from July through October. Its movements included the recurring 500 $BTC transactions and September’s enormous 1,260.78 $BTC transfer.
Another curious finding concerned transaction timing. During the first six months, Saturdays and Sundays accounted for 193 of 526 transfers, or 36.7%, despite representing approximately 29% of calendar days. Those weekend movements carried 8,269.77 $BTC, equivalent to 44.3% of first-half volume. Saturday recorded the greatest bitcoin volume, while Sunday led in the number of transfers.
The concentration could reflect scheduled operational activity or favorable transaction conditions, although the available records cannot establish precisely why certain holders favored weekends.
What Exactly Does Btcparser Monitor?
Understanding Btcparser’s methodology is important when interpreting the figures. Its version 1 monitoring service was designed specifically to detect activity involving historically inactive bitcoin addresses, rather than measure every movement of previously dormant bitcoin across the network.
According to the service’s published description, Btcparser version 1 continuously monitors 64,529 addresses, including 21,519 originating in 2009, 12,396 from 2010, and 3,598 from 2011. Its historical address coverage extends through July 2017, with additional monitoring categories associated with the infamous Mt Gox theft and the Bitfinex hack.
However, the monitored population is selective. It does not represent every historical Bitcoin address, every address format, or every coin that has remained inactive for an extended period. The 33,932.19 $BTC identified in the report, therefore, represents activity captured through the examined Btcparser records, not a comprehensive accounting of all dormant bitcoin revived in 2026.
Checkonchain Reveals More Than 227,000 $BTC Revived in 2026
The broader picture becomes considerably more interesting when the Btcparser findings are compared with Checkonchain’s Total Revived Supply by Year Acquired ($BTC) metric. According to the analytics provider’s stats, approximately 227,196.10 $BTC acquired before 2019 (now worth $183.58 billion) had been revived during 2026, a figure substantially larger than the movements documented through the narrower Btcparser examination.
Of that amount, 186,123.72 $BTC, or 81.9%, originated from coins acquired between 2015 and 2018. Another 27,653.01 $BTC came from the 2012-2014 period, while just 13,419.37 $BTC originated before 2012. These figures establish that the overwhelming majority of revived pre-2019 bitcoin originated from comparatively younger holdings, rather than the earliest years of Bitcoin’s existence.
Source: Checkonchain, as cited in Bitcoin.com News.
The distinction between the two datasets is essential. Btcparser documents specific movements from selected historically inactive addresses, while Checkonchain measures a broader category of revived supply based on acquisition periods. Consequently, the 33,932.19 $BTC identified through Btcparser is equivalent to approximately 14.9% of Checkonchain’s larger pre-2019 revival figure.
That comparison illustrates the relative scale of the two measurements, rather than establishing a directly interchangeable subset. Ultimately, the two datasets tell complementary stories about the network’s aging supply. Btcparser exposes the individual movements, including ancient mining rewards, coordinated sweeps, and recurring multimillion-dollar transfers, while Checkonchain reveals the much larger volume of older coins returning to activity.
Neither measurement establishes that the bitcoin was sold. The evidence instead shows that long-held supply continues to move, even as the oldest coins represent only a modest fraction of the broader revival. The blockchain reveals when sleeping bitcoin awakens, but not necessarily why its owners have chosen to disturb it.