Ethereum is trading near $2,297, up 1.93% on the day. ETH bounced from a low of $2,226.44 and touched $2,306.43 during the session.
The move comes after reports that Democrats won the US Senate and the House. Many crypto traders see that as a less friendly result than Republican control.
Nothing is final yet. Still, politics can shift the mood fast, and crypto often reacts first.
Senate Shock: Why Crypto Traders Are on Edge
Democrats flipped states that Donald Trump won by double digits in 2024. Texas and Kansas elected Democrats to the Senate for the first time in decades.
Republican leaders and the Trump administration had pushed for stablecoin rules and self-custody protections. Traders now wonder if that push is slowing down.
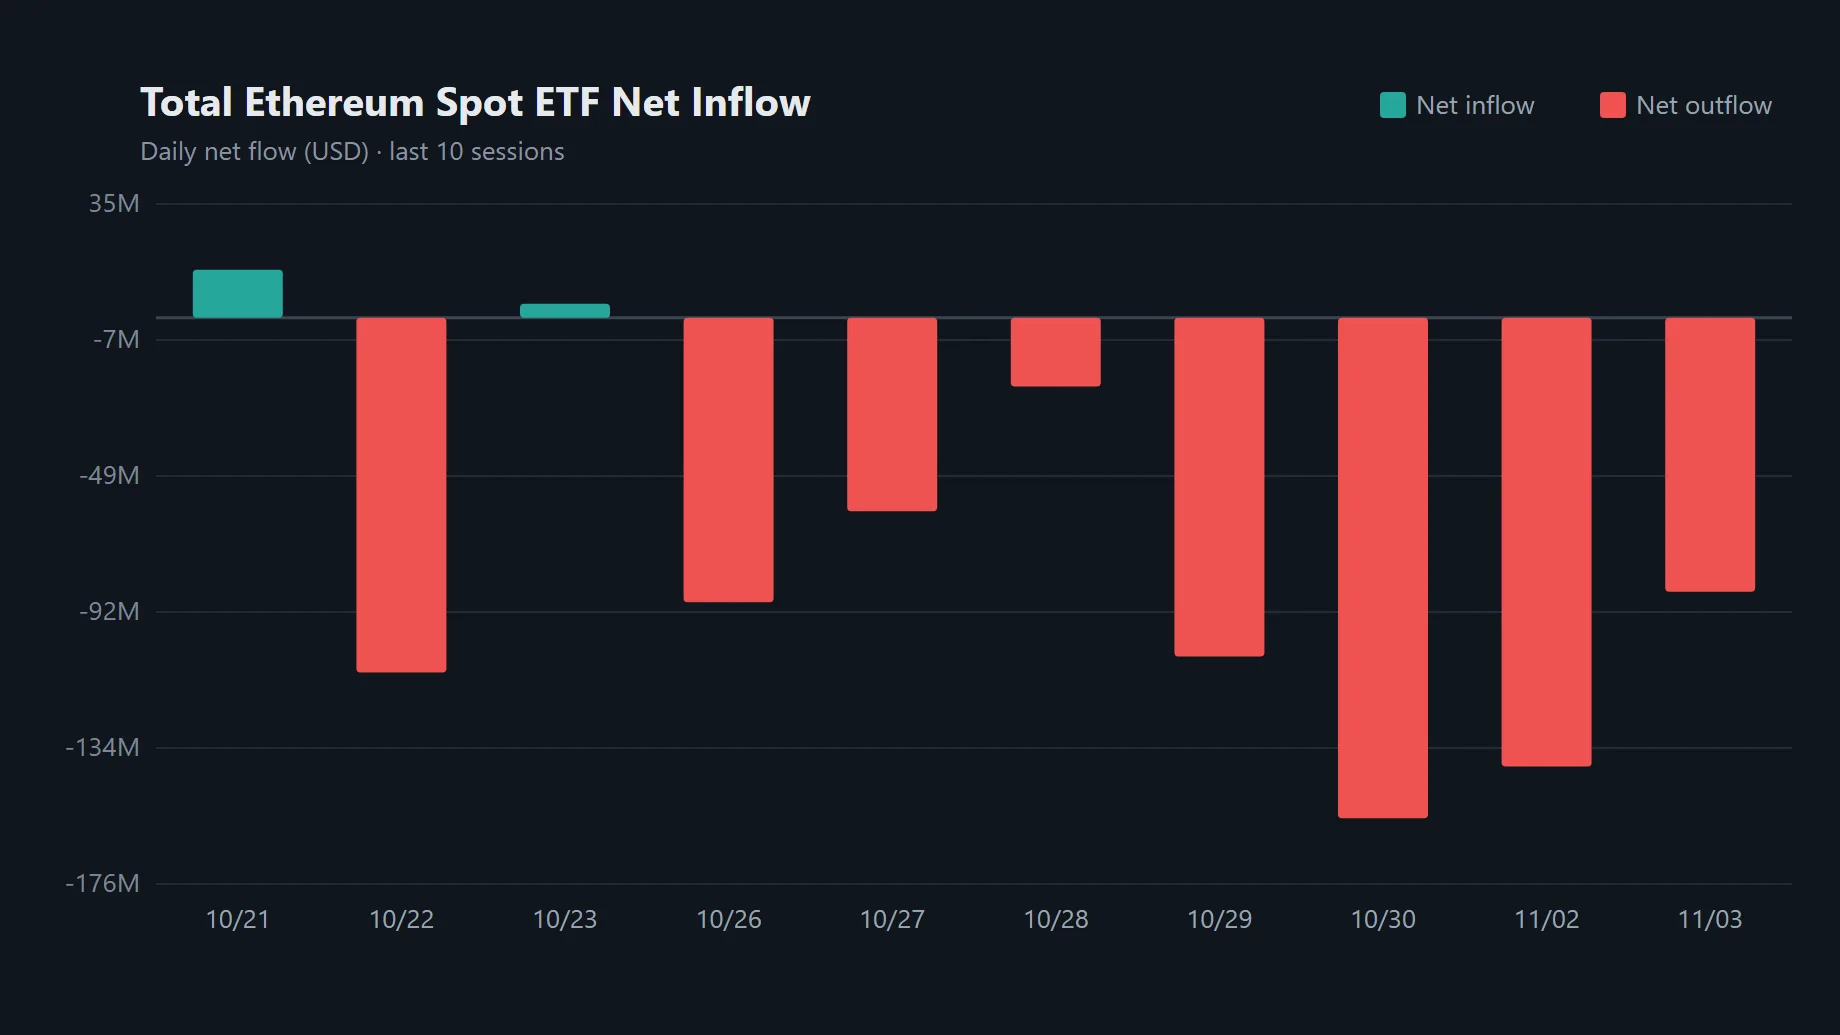
ETF Outflows Hit $85.35M: Are Big Buyers Stepping Back?
The US Ethereum spot ETF market recorded a net outflow of $85.35 million on November 3, as per SoSoValue.
BlackRock's ETHA led the exits with $74.44 million out. Grayscale's ETH followed with $10.91 million. Other funds showed no flows.
The bigger picture still looks solid. Cumulative net inflows stand at $12.06 billion. Total net assets are $13.32 billion, or 4.76% of ETH's market cap.
Daily trading value reached $352.94 million. For now, the selling looks short-term.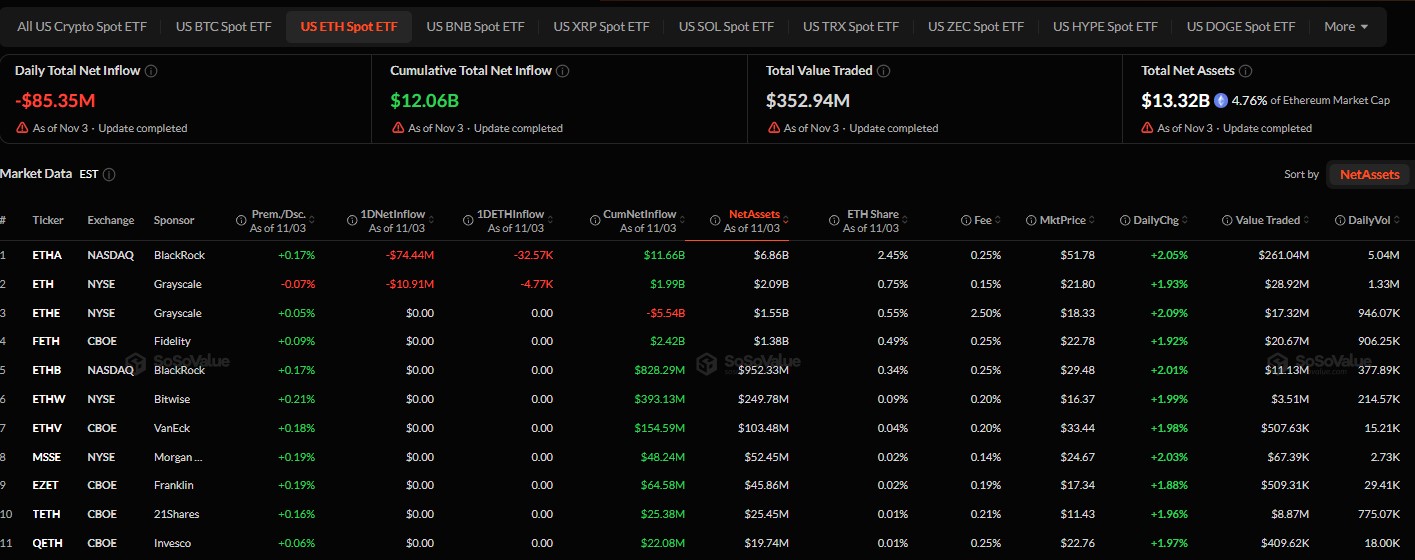
Derivatives Lean Slightly Bullish, but Longs Took the Bigger Hit
Futures volume rose 24.26% to $36.18B. Open interest gained 2.84% to $28.52B. That points to fresh positioning.
The overall long/short ratio is 1.008, so the market is almost even. Binance ETH/USDT accounts lean long at 2.4674, and OKX shows 2.01.
Top traders on Binance sit at 2.1133 by accounts and 1.669 by positions.
Liquidations tell a mixed story. In the last hour, shorts lost $4.73M against $388.38K for longs. Over 24 hours, though, longs lost $35.56M and shorts lost $31.95M.
Bulls have a mild edge, not a clear win.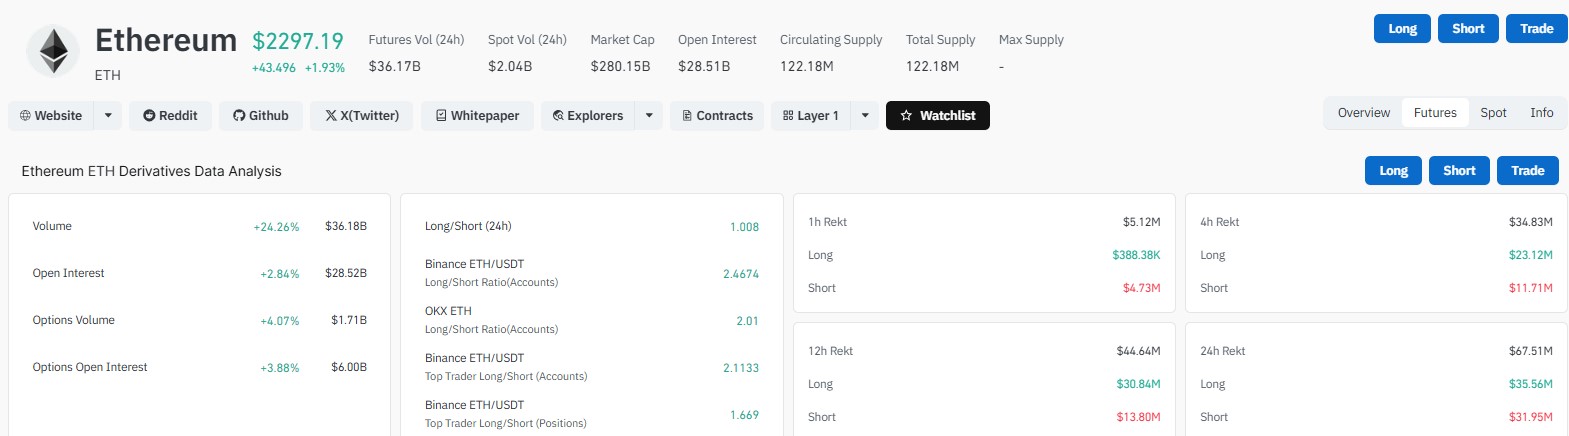
Falling Wedge Hints at a Possible Reversal on the Daily Chart
On the 1-day chart, ETH/USDT is forming a falling wedge. This pattern can signal a bullish turn if price breaks the upper trendline.
The trend is still weak, though. The altcoin trades below the 20, 50, 100, and 200 EMAs. RSI is near 40, which shows soft momentum but is close to oversold.
Analyst Ali Charts pointed out that Ethereum fell 22.64%, from $2,806 to a low of $2,171. The TD Sequential then flashed a buy signal on the 3-day chart.
He sees a rebound to $2,500 as possible. Above that, the $2,700 resistance trendline comes into focus.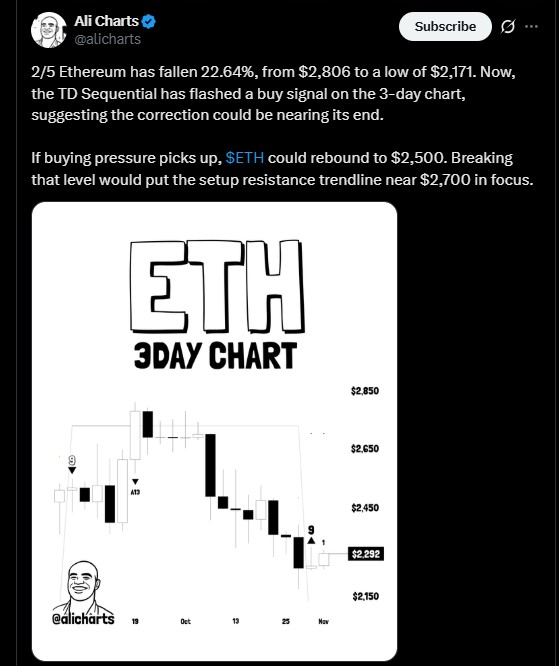
Key ETH Levels Traders Are Watching
Level
Price Zone
What It Means
Support 1
$2,220 to $2,250
Immediate floor near the wedge base
Support 2
$2,150 to $2,100
Next area if $2,220 breaks
Resistance 1
$2,350
First recovery target
Resistance 2
$2,405 to $2,450
Next hurdle for buyers
Breakout Zone
$2,500 to $2,600
Needs a strong daily close above the wedge
Trendline
Near $2,700
Larger resistance if $2,500 breaks
What Could Happen Next for ETH?
If support at $2,220 to $2,250 holds, ETH could try a move to $2,350. After that, $2,405 to $2,450 is the next test.
A strong daily close above the wedge, backed by rising volume, could open the path to $2,500 to $2,600.
If ETH drops below $2,220, the bearish trend may continue toward $2,150 and $2,100.
Overall, Ethereum shows some reversal potential. But a wedge is only a setup until price breaks out. ETF flows and the political news could decide the next move.
Disclaimer
This article is for information only and is not financial advice. Cryptocurrency trading carries a high risk, and prices can move fast. You can lose some or all of your money. Do your own research and speak to a licensed financial advisor before making any investment decision.
About the Author Lokesh Gupta
Research Analyst at coingabbar.com
Lokesh Gupta started his journey in financial markets 23 years ago and never looked back. From Forex to Comex, NSE, MCX, NCDEX, and now Crypto — he has seen it all. He holds an MBA in Finance and over the last 4 years, Bitcoin, Ethereum, Solana, XRP, and trending coins have become his main focus. People who follow his work say one thing — he keeps it real. No fancy language, no unnecessary complexity. Just honest market research that helps you understand what is happening and why it matters to your money.
 November 3, 2026
November 3, 2026
November 3, 2026
November 2, 2026
November 2, 2026
November 2, 2026
October 30, 2026
October 29, 2026
Frequently Asked Questions (FAQ)