Article produced with artificial intelligence systems and published under the editorial responsibility of Amelia Tomasicchio. How we work
A trader’s $45.3 million leveraged bet is backing the bullish side of the debate over an Ethereum price bottom near $2,000. Tom Lee’s bottoming thesis has support from one striking liquidation window: nearly $300 million in long positions were wiped out over 48 hours, yet ETH declined just over 1%. Weakening staking demand and persistent ETF withdrawals point the other way.
Summary
Key takeaways
- Ethereum absorbed nearly $300 million in long liquidations with a limited price decline.
- A trader claiming a perfect record opened a $45.3 million position at 25x leverage.
- Staking demand and ETF flows challenge the bullish bottoming thesis.
Heavy Ethereum liquidations meet a smaller price correction
CoinGlass data showed nearly $300 million in long liquidations during a 48-hour period, accompanied by a price correction of just over 1%. That limited decline suggests relatively contained selling pressure during that window, rather than confirmation that a bottom has formed.
The contrast with October was substantial. Almost $500 million in positions were liquidated as Ethereum lost support at $2,500 and fell 7%.
A separate CoinGlass snapshot for November 6 showed how heavily leveraged bullish positions remained exposed: Ethereum recorded more than $210 million in liquidations over 24 hours, including $179 million from longs.
CryptoQuant data also showed derivatives open interest falling to approximately $11.4 billion by November 6, from nearly $16 billion in late September. That measures fewer outstanding contracts, not a bullish or bearish preference on its own.
A $45.3 million long backs a potential recovery
The trader opened a long position covering 20,277 ETH at 25x leverage, betting on higher prices. The position had recorded $252,000 in profit in the snapshot described.
The trader claims a 100% win rate. The previous 10 trades produced $6.32 million in realized gains, with all 10 recorded as profitable.
The position, alongside ETH’s limited decline during the 48-hour liquidation window, suggests bullish positioning ahead of a possible recovery. It supports the direction of Lee’s Ethereum price bottom thesis without establishing that the wider market has turned.
Staking and ETF flows test the Ethereum price bottom thesis
Demand indicators remain a challenge to Lee’s view that Ethereum is bottoming near $2,000. Staking interest has weakened, while ETF withdrawals show continued pressure from institutional investment flows.
ValidatorQueue recorded 1,036,882 ETH, worth more than $2.3 billion, waiting to enter Ethereum’s validator queue. That compares with 3,737,802 ETH six months earlier, suggesting fewer investors were seeking to lock their holdings for staking rewards.
Ethereum ETFs recorded $270 million in net outflows in less than a week after November began, following five weeks of outflows. October’s withdrawals totaled $1.6 billion; continued outflows would add pressure to recovery prospects.
Daily figures show the uneven demand. SoSoValue data recorded $53 million in net inflows on November 4, followed by nearly $100 million in withdrawals on November 5. BlackRock’s ETHA accounted for $75.2 million of those withdrawals.
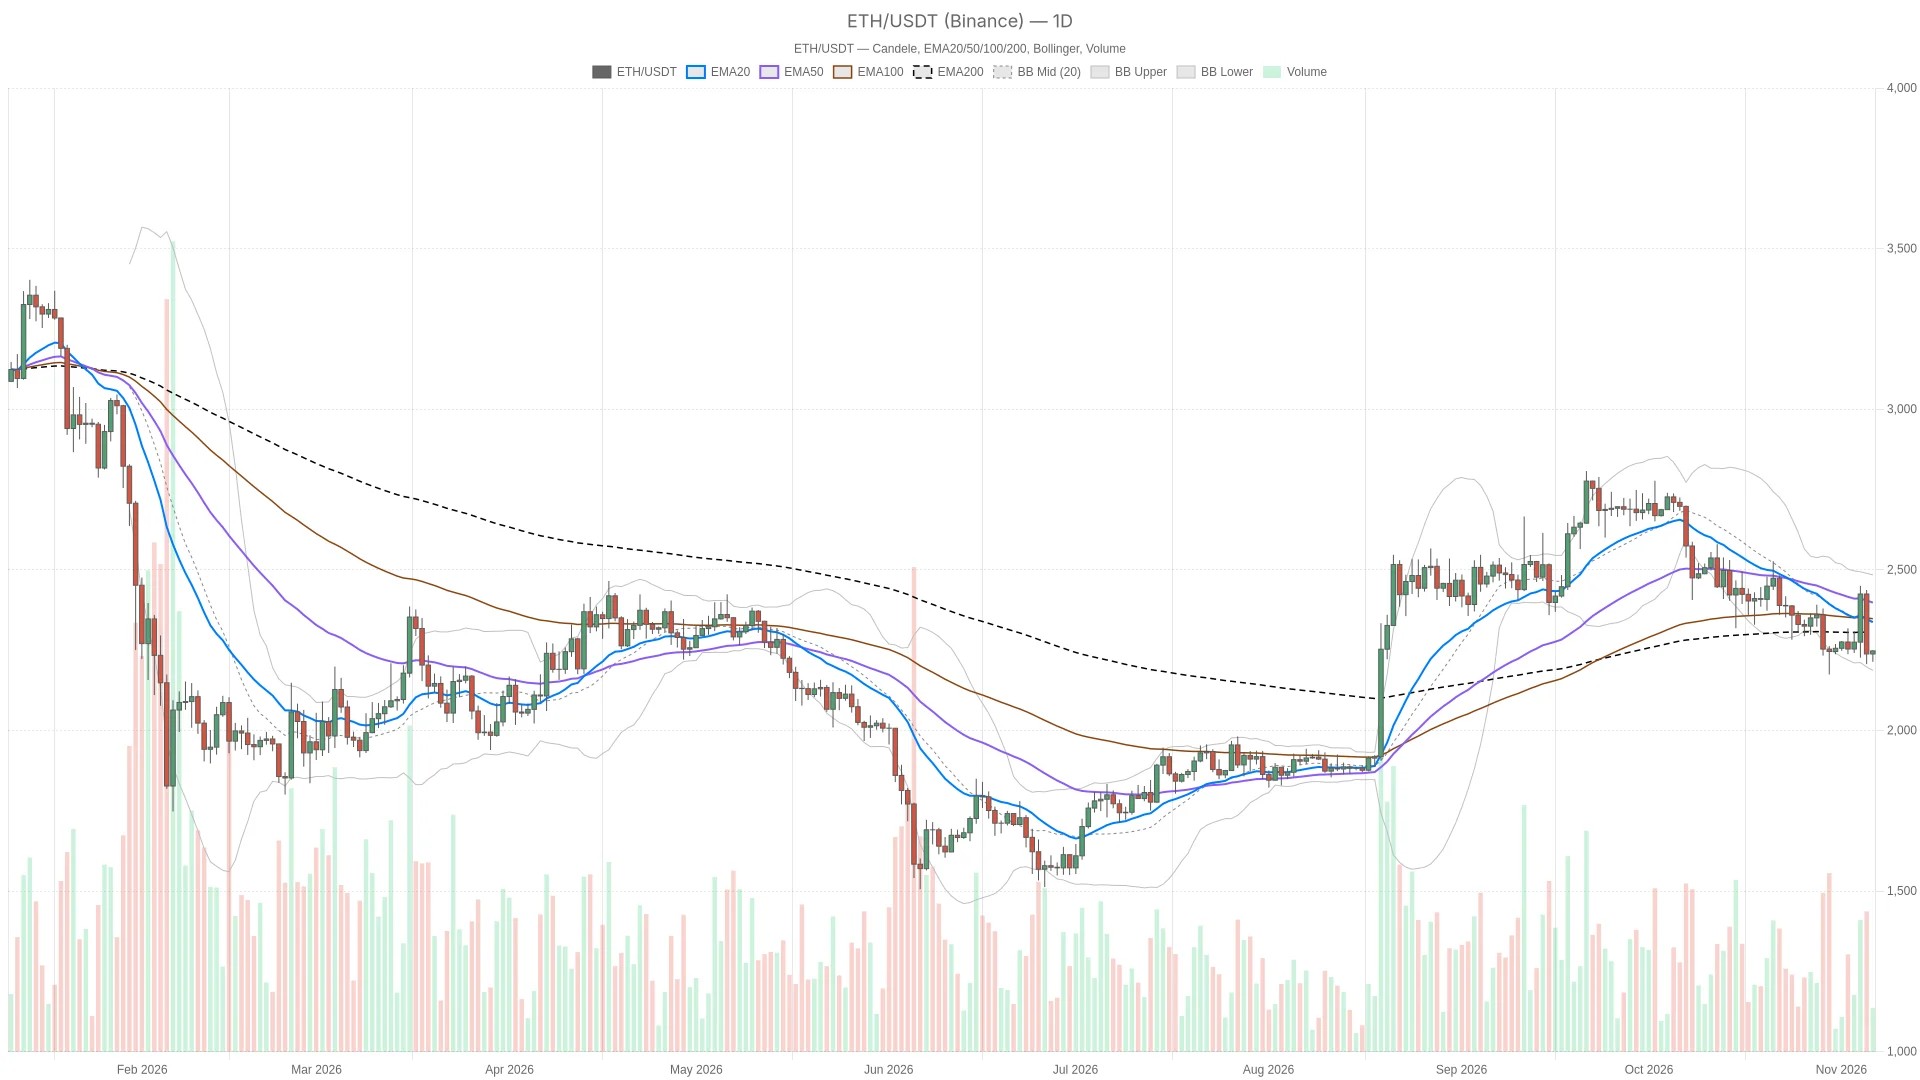
A large long-liquidation cluster sits below $2,200. Under continued weak sentiment, a move through that area could take ETH below $2,000 before a potential reversal—the downside scenario challenging the bottoming call.
Technical readings also show weak buying momentum. TradingView’s November 5 chart placed daily Fibonacci support near $2,240 and weekly Supertrend support around $2,008. As of November 6, Ethereum’s Relative Strength Index had reached 38.65, a figure that sat beneath the neutral mark of 50 yet remained higher than the typical oversold level of 30.
Article produced with the assistance of artificial intelligence and reviewed by the editorial team.