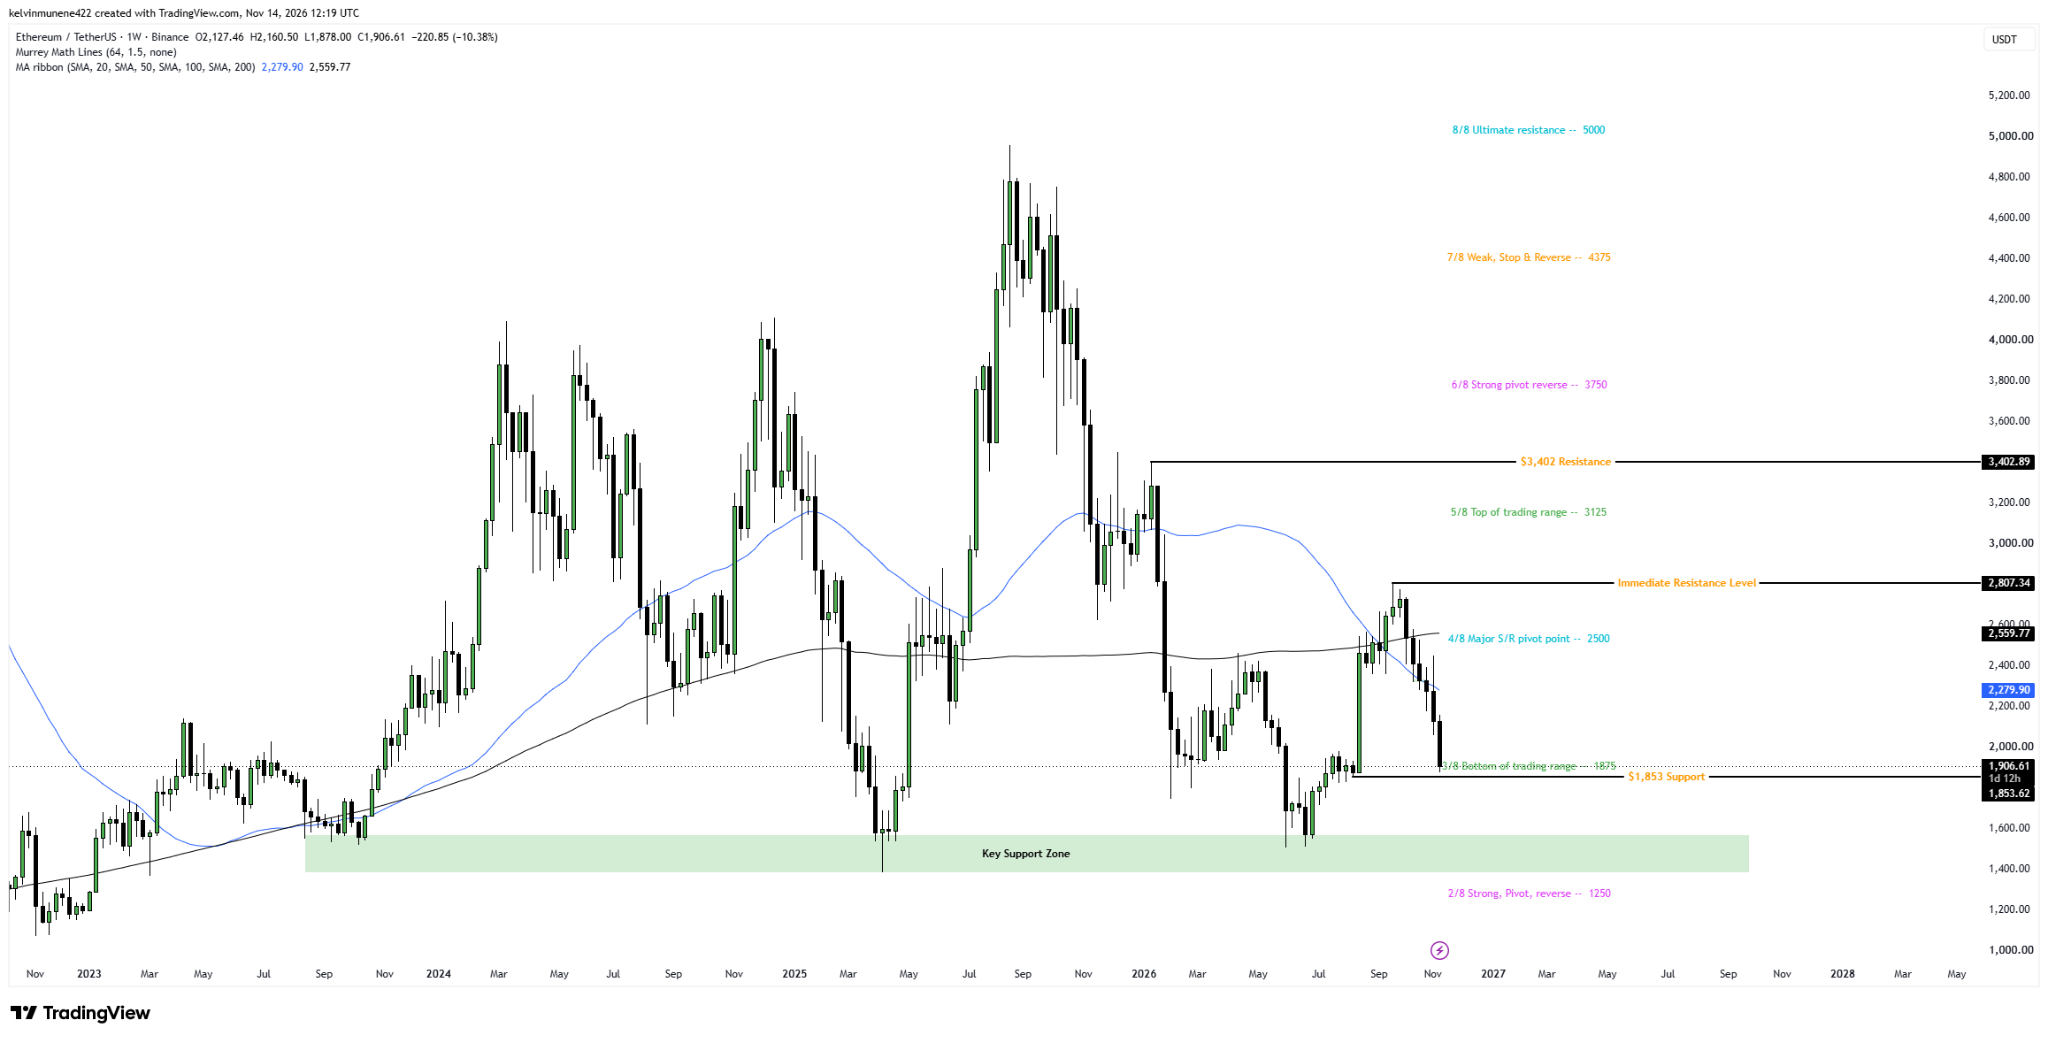
Ethereum Price USD has fallen 32% from its September high, bringing the crypto back below $2,000. ETH crypto traded near $1,930 on Friday, after touching $1,897 during the decline. A TD Sequential buy signal has appeared on the daily timeframe, although sellers still control the market trend. Traders now face a test of the support area between $1,850 and $1,950.
Ethereum Price Prediction: Buy Signal Follows 32% Decline
Ethereum price dropped 32.40% from $2,806 on September 21 to $1,897 in November. The decline erased gains from the late-summer rally and pushed ETH crypto below a descending channel. The top altcoin slipped beneath several daily moving averages, leaving resistance above its current trading range.
ETH crypto TD Sequential indicator printed a nine-count buy signal on the daily chart. Traders use the indicator to identify potential exhaustion after sustained price movements. A buy signal can precede a rebound, but it does not confirm that the decline has ended.
Daily relative strength index readings have also moved into oversold territory. The daily RSI stood at 24.48, while the two-day indicator registered a reading near 32. Both readings reflect weak momentum, with the shorter timeframe registering greater selling pressure.
Merlijn The Trader compared the current setup with Ethereum‘s correction in 2025. During that earlier period, ETH crypto briefly lost support near $2,100 before recovering toward $3,700.
Ethereum Price USD Faces Resistance Above $2,000
Ethereum price must first recover the $2,000 level to challenge the immediate overhead barriers. The former channel boundary near $2,115 stands above that mark. A separate technical projection identifies the 200-day simple moving average around $2,150 as another possible recovery test.
On the weekly timeframe, the middle Bollinger Band sits near $2,232. The latest weekly candle trades below this level, while a marked resistance zone stretches across $2,130 to $2,230. A stronger advance would bring the descending resistance line near $2,435 into view.
Support remains concentrated around $1,873, close to the lower edge of the latest trading range. Ted Pillows identified $1,850 to $1,950 as the final major support zone before lower cycle levels.
ETH crypto breaking below that area would expose the weekly lower Bollinger Band near $1,597. The band changes as new price data arrives.
Whale Long Positions Rise During Ethereum Selloff
Large derivatives traders have increased their bullish exposure despite the price decline. Analyst CW reported that Ethereum’s Whale vs Retail Delta crossed 0.6, indicating a widening gap between large and smaller traders’ positioning.
Exchange positioning data also showed more long than short accounts among top traders. Binance recorded a ratio of 1.82, compared with 2.11 on OKX.
Network data placed Ethereum’s staked supply near 36% on November 13. Staked assets help secure the network and remain distinct from traders’ leveraged positions.
Kelvin is an experienced crypto journalist with over 6 years of experience backed by an Actuarial Science and English Degree. He has over 10,000 works published under his profile in several major media sites in the crypto, Web 3, and Finance sectors.
About this article
This report follows our Editorial Policy, Fact-Checking Standards and Code of Ethics. Found an inaccuracy? See Corrections.
Disclaimer. Informational only, not financial advice. Crypto, forex and stocks are volatile, high-risk assets — always do your own research and consult a qualified adviser.