Is $9.115 the next stop for INJ after the ETF news?
Buyers took $INJ to $8.51 at 11:00 UTC after Injective said Nasdaq approved a staked ETF. That gives the Injective price prediction a fresh starting point, and now buyers have to defend it. For the earlier setup, see the prior INJ forecast.
Injective 24-Hour Price Forecast Snapshot
CoinGecko market data captured at 11:00 UTC on Nov 5, 2026, ranks Injective at 83rd. Fully diluted valuation (FDV) is the value if every token existed, and here it equals the market cap.
Metric
Value
Price
$8.454
24h range
$7.60 to $8.56
Market cap
$853.148M
FDV
$853.148M
24h trading volume
$117.628M
Source: CoinGecko, INJ market snapshot, Nov 5, 2026, 11:00 UTC
All 100M tokens already circulate, so no new supply waits to hit the market. Volume of $117.628M shows how easily traders can enter and exit.
INJ News: Nasdaq Approves Staked ETF
A staked ETF is a fund that holds a token and locks it in staking to earn rewards. Per the official Injective X post, Nasdaq has officially approved the listing of the first INJ staked ETF, ticker INJC.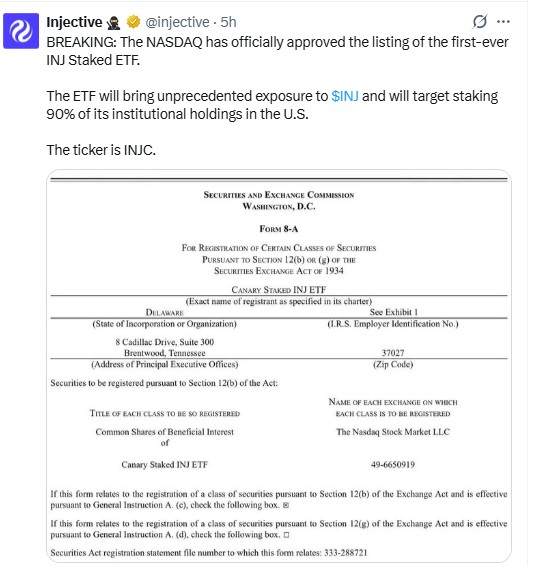
Source: Injective official X post, about five hours old at the Nov 5, 2026, 11:00 UTC capture
The post says the fund will target staking 90% of its institutional holdings in the U.S.
If trading starts, holding $INJ means buying it, and staking locks those tokens away from sellers. If the launch slips, the rally loses its main catalyst, and the price may slide toward $8.125 support. For future context, see the Bitnomial INJ futures update.
INJ Price Performance: Rally Nears 24h High
CoinGlass price performance data at 11:00 UTC shows $INJ up 10.07% in 24h and 10.14% in 30 days. The 90-day gain is 84.93%.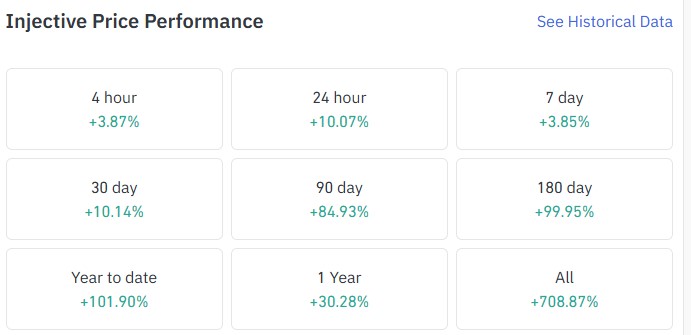
Source: CoinGlass, $INJ price performance, Nov 5, 2026, 11:00 UTC
The price of $8.454 trades 0.6% below the 24h high of $8.56 and 12.0% above the $7.60 low. Buyers sit near the range top, so late entries carry the most risk. For wider context, see the latest crypto market news.
Injective Liquidation Data: Shorts Burn
Shorts got hit hard. CoinGlass liquidation data, captured at 11:00 UTC, shows $615.09K liquidated in 24h. Shorts lost $530.07K of that. Longs lost $85.02K.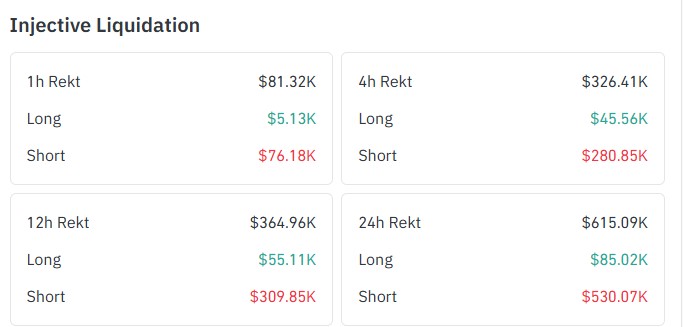
Source: CoinGlass, $INJ liquidation data, Nov 5, 2026, 11:00 UTC
In the last hour, shorts lost $76.18K against $5.13K for longs. Forced short covering means forced buying, and that can lift price until shorts run out.
INJ Open Interest: Binance Leads Futures
Open interest is the total value of futures contracts that traders are still holding. On CoinGlass, $INJ open interest was $141.31M at 05:30 UTC on Nov 5, 2026, still under the $205M peak from mid-October.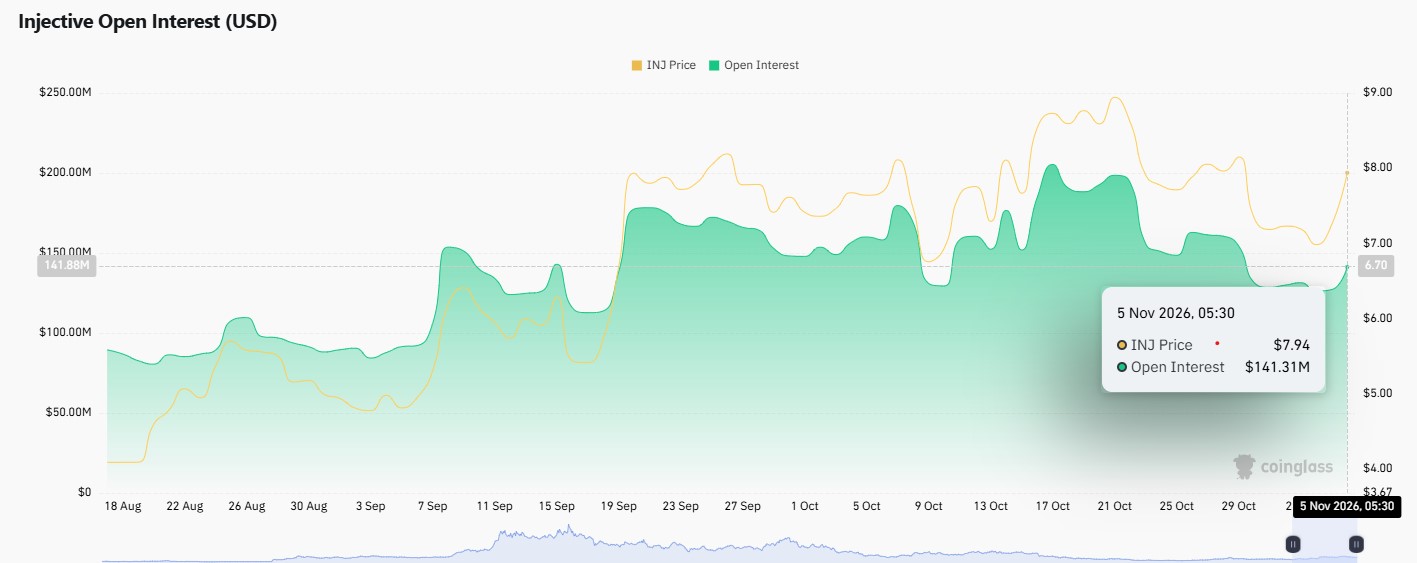
Source: CoinGlass, $INJ open interest chart, Nov 5, 2026, 05:30 UTC
Open interest is going up along with price, so new traders are opening positions instead of just closing old ones.
INJ Technical Analysis: Falling Wedge Breakout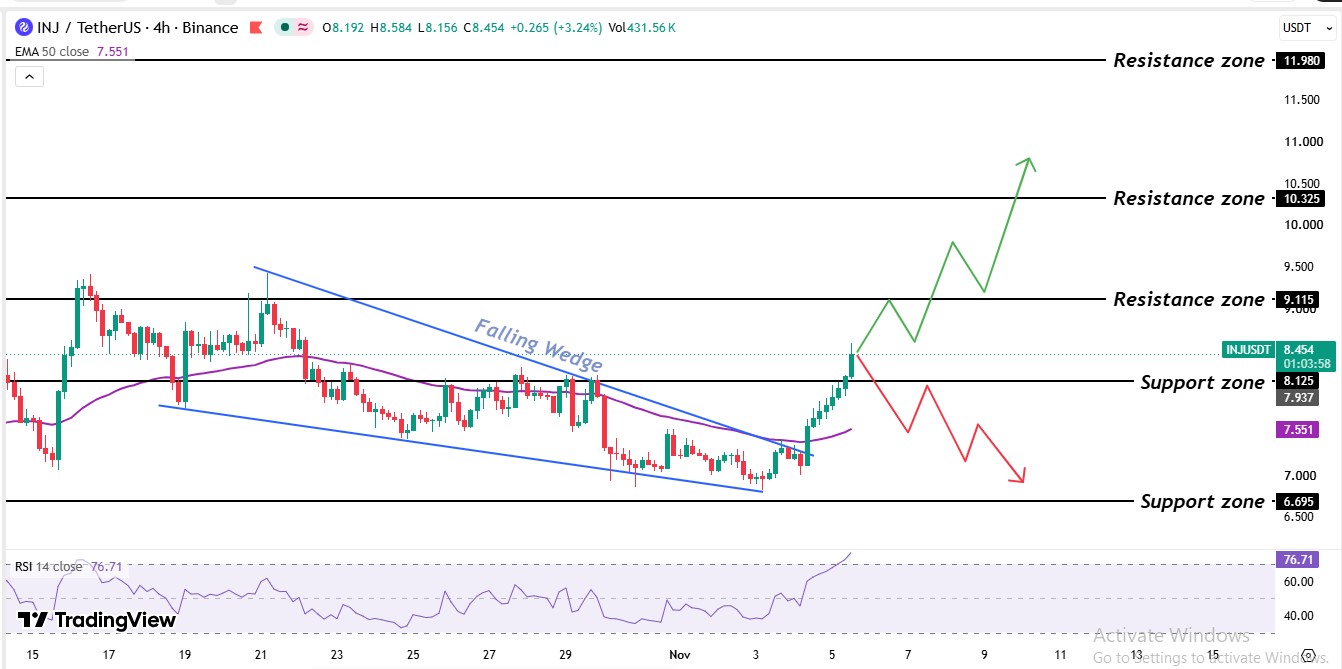
Source: TradingView, $INJ/USDT 4H, Nov 5, 2026, 11:00 UTC
The Binance 4H chart for INJ/USDT on TradingView, captured Nov 5, 2026, 11:00 UTC, frames this Injective price prediction. A sharp October rally spiked to the $9.40 level before sellers took control.
Price then slid inside a falling wedge, two sloping trendlines that squeeze price toward a breakout. The market tried many times to break the upper trendline, but sellers defended it until Nov 4.
The price bottomed near the $6.85 level, above the $6.695 support zone. A strong green candle on Nov 4 then broke the upper trendline of the wedge and pushed through the $7.551 4-hour 50 EMA level, where sellers had capped earlier bounces.
The $INJ 50 EMA sits at $7.551, and INJ's $8.454 price trades 12.7% above it. The latest 4-hour candle trades above the EMA level.
The $INJ RSI reads 76.71 on the 14-period 4-hour setting. Above 50 means buyers hold the edge. Above 70 means overbought, where a pullback often follows.
INJ Support Levels and Resistance Levels
Level
Role
$11.980
Resistance
$10.325
Resistance
$9.115
Resistance
$8.125
Support
$7.551
50 EMA
$6.695
Support
Injective Price Prediction: Bull, Base, and Bear Scenarios
Scenario
Trigger
Target
Invalidation
Bull
4-hour candle trades above $9.115
$10.325
Back under $8.125
Base
Range of $8.125 and $9.115
Range
Range breaks
Bear
4-hour candle trades under $8.125
$7.551, $6.695
Reclaims $8.125
The bull case needs an $8.125 level to hold first. The bear case gains weight if RSI drops under 50.
Regulatory delay is a risk, since a slipped INJC launch removes the main catalyst. ETF-flow reversal is another, because net outflows would force the fund to sell $INJ. A 4-hour candle under the $8.125 level would turn the breakout into a false breakout, a move that clears a level and then fails.
Injective Price Outlook: Expert view
As per CoinGabbar analysis, the Injective price prediction leans bullish, while $INJ holds above the $8.125 level. a $7.551 EMA now below price, and $530.07K of short liquidations back that view.
The breakout points straight to $9.115. RSI at 76.71 argues for a retest of $8.125 first.
The condition to watch is a 4-hour candle trading under the $8.125 level, which would end the squeeze and hand control to sellers.
YMYL Disclaimer: This article is for educational and informational purposes only. It does not offer financial advice, price guarantees, or return promises. Crypto assets are volatile
About the Author Dikshant Dibbey
Technical Analyst at coingabbar.com
Dikshant Dibbey is a crypto technical analyst with two years of knowledge and experience in the cryptocurrency and Web3 space. He has a strong interest in analyzing Bitcoin, altcoins, blockchain technology, and the evolving digital asset market. His focus is on understanding market trends, price movements, and technical indicators to help readers gain a clearer perspective on the crypto market. Through his content, Dikshant aims to simplify complex cryptocurrency concepts and provide readers with insightful, accurate, and easy-to-understand information.
 6 hours ago
7 hours ago
9 hours ago
November 3, 2026
November 3, 2026
November 3, 2026
November 3, 2026
November 2, 2026
November 2, 2026
Frequently Asked Questions (FAQ)