Is the slide from $2.483 finally running out of sellers?
This LayerZero price prediction begins at $1.556, where ZRO traded on Binance as of Nov 11, 2026, 08:22 UTC, up 1.30% on the daily candle.
Price sits under a stack of moving averages while a descending channel still caps every bounce. The previous LayerZero price levels add useful context on how far this token has travelled.
LayerZero Price Prediction Data Snapshot
Price and Volume Readings
CoinMarketCap data shows ZRO at $1.57, up 5.29% over 24 hours, on $64.6M in volume. That's 10.15% of market cap changing hands, a decent turnover for a #74 token.
Coinglass reads a touch lower at $1.559 and +4.60%. But the 24-hour range of $1.443 to $1.599 matters more, because buyers defended the same $1.45 floor again.
Supply and Valuation Behind the $ZRO Price Outlook
Circulating supply is 405.42M ZRO out of 1B, so 40.5% trades in public hands. Market cap is $636.91M against a fully diluted valuation of $1.57B.
That leaves 594.58M ZRO outside circulation, a gap every $ZRO price outlook has to respect.
Derivatives Positioning
Coinglass derivatives data puts open interest at $161.19M, up 3.65%, equal to 25.40% of market cap. The funding rate sits at -0.0139%, so shorts are paying longs.
Spot netflow shows an outflow of $2.9M, and futures show $1.5M leaving. And liquidations stayed light at $114.41K, 75% of it longs, while Fear and Greed reads 30.
$ZRO Price Analysis From the October Spike to Today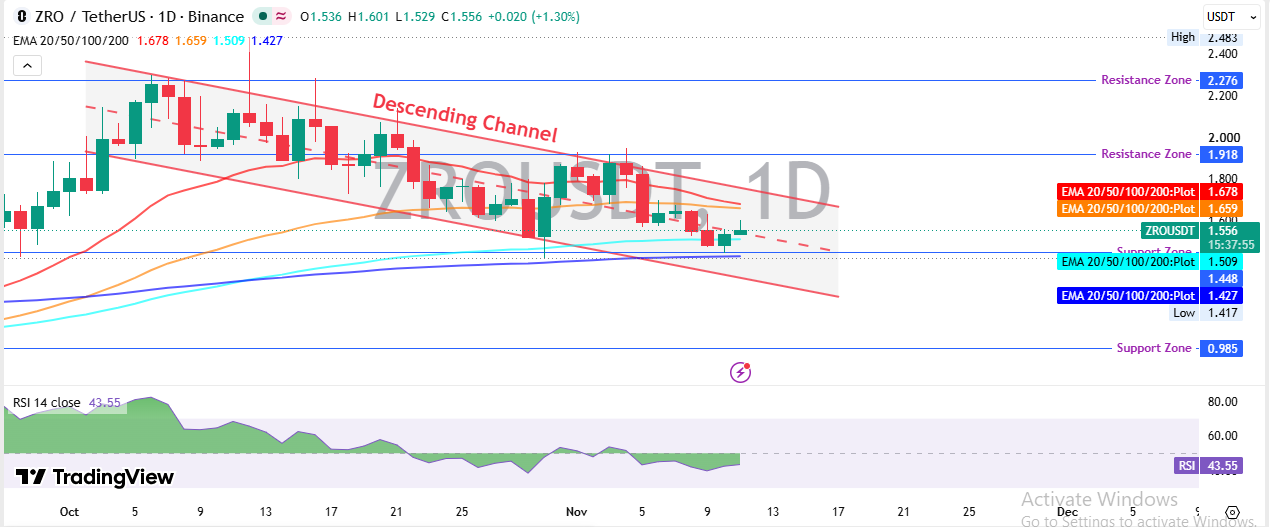
How the Descending Channel Formed
Early October belonged to buyers. Daily candles stacked higher, RSI pushed past 80, and a wick on the Oct 12 candle tagged $2.483, the high on this chart.
Then the mood flipped. Rallies kept failing at lower levels, first near $2.28 and later around $2.10, until the highs and lows traced a pair of sloping lines that mark the channel.
Sellers pressed price into the $1.448 support zone. Buyers stepped in. A bounce carried ZRO back to roughly $1.95, right at the $1.918 resistance zone, and stalled there.
But that rejection did the damage. A string of red candles followed, the price slid to a $1.417 low on the Nov 9 candle, and today's candle opened at $1.536 before trading at $1.556.
Moving Averages and RSI Today
Four exponential moving averages frame the chart. The EMA 20 at $1.678 and EMA 50 at $1.659 hang overhead, while the EMA 100 at $1.509 and EMA 200 at $1.427 sit underneath as a cushion.
RSI at 43.55 is under the 50 midline yet far from oversold. Sellers still lead without being exhausted.
The bounce reads like a reversal. Actually, that's too generous, since price is still trading under both overhead EMAs and inside the channel. This ZRO price analysis stays bearish below $1.68.
Traders comparing setups can scan other crypto price predictions for context.
Why Is ZRO Moving Today?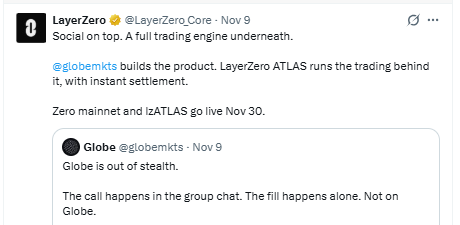
Catalyst alert. LayerZero's X post says Zero mainnet and lzATLAS go live Nov 30. Globe, a social trading product, is out of stealth. ATLAS runs the engine underneath, with instant settlement.
Volume hasn't exploded. Spot trading sits near $20.80M on Coinglass.
Who Holds the Supply?
Who's sitting on enough supply to cap a rally?
Etherscan holder data lists the LayerZero Future Initiatives Multisig as the largest wallet, near 11.15% of supply and about $167.6M in value. A Binance cold wallet holds roughly 3.68%.
But concentration only matters when coins move. A single transfer toward an exchange would weigh on the LayerZero price prediction faster than any chart line.
ZRO Price Forecast Scenarios
Scenario
Trigger
Target
Invalidation
Liquidity Condition
Bull
Daily candle trading above $1.68
$1.918, then $2.276
Daily trading under $1.509
Spot volume rising above $20.80M with positive netflow
Base
Price holds between support and the EMA cluster
$1.448 to $1.68 range
Daily trading above $1.68 or under $1.448
Spot volume near $20M, negative funding stays
Bear
Daily candle trading under $1.448
$1.417, then $0.985
Daily trading back above $1.68
Outflows grow beyond $2.9M, longs get liquidated
Bull Case
A daily candle trading above $1.68 puts the EMA 20, EMA 50 and channel roof underneath price. That opens $1.918, about 23% higher. Hold there, and $2.276 comes into play, near 46% above $1.556.
Bitcoin usually sets the tone for altcoin buyers, so the latest Bitcoin price prediction deserves a read.
Base Case
The $1.448 floor supports, the $1.68 caps, and the negative funding rate keep both camps trading inside a 16% band.
Bear Case
Should $1.448 give way? Then $1.417 comes first, with $0.985 beneath, a drop near 37% from $1.556.
A weak tape for Ethereum would feed that move, since ZRO lives on the network. The Ethereum price prediction covers that backdrop.
What Could Change the Outlook
Reclaim $1.68 on rising spot volume. Only then does $1.918 matter.
The Nov 30 launch is the one-dated event, and a crypto events calendar keeps it on the radar next to netflow data.
Key Levels to Watch
Support starts at $1.448, with $0.985 as the deeper floor. Resistance begins at $1.68 and stacks up toward $1.918 and $2.276.
A daily candle trading above $1.68 with spot volume over $20.80M confirms a breakout. Fresh blockchain news updates can show whether that volume has a source. Breakdown risk starts under $1.448.
Risks That Could Change the LayerZero Price Prediction
Supply is the loudest risk. Only 40.5% of tokens circulate, so any change in release schedules would hit expectations fast.
Sentiment adds pressure. Fear and Greed reads 30, and net outflows say buyers aren't rushing in.
Liquidity can shift on listings too, which makes exchange listing updates worth tracking.
But the stance stays clear. ZRO is a bearish-leaning range trade until a daily candle trades above $1.68.
Disclaimer: This article is for information only and isn't financial advice. Crypto prices swing fast, and every level here can fail. Research independently before trading.
About the Author Aashish Vishwakarma
Technical Analyst at coingabbar.com
Aashish Vishwakarma is a crypto analyst, technical analyst, and content writer with 2+ years of experience in cryptocurrency research and financial markets. He covers crypto market analysis, price predictions, technical indicators, market trends, digital assets, and blockchain developments, delivering clear, data-driven insights through engaging content.
 November 9, 2026
November 5, 2026
November 5, 2026
November 5, 2026
November 5, 2026
November 3, 2026
November 3, 2026
November 3, 2026
Frequently Asked Questions (FAQ)