Can NEAR reclaim the $5.911 level, or does the slide run toward $2.848?
NEAR enters November below its 50-day EMA, a price average that weights recent days most. The Near Price Prediction November 2026 starts with buyers defending $3.691 support once. See the NEAR technical analysis today for the earlier view.
NEAR Market Snapshot and November Outlook
CoinGecko market data, captured 06:38 UTC, anchors the Near Price Prediction November 2026 at $3.912.
Metric
Value
Price
$3.912
Market cap
$5.14B
FDV
$5.14B
24h volume
$581.069M
Open interest
$1.667B
Source: CoinGecko, NEAR market snapshot, Nov 4, 2026, 06:38 UTC.
NEAR Pump.fun News and Catalyst
Pump.fun is a token trading app. Per the official NEAR Protocol X post, NEAR tokens are now live on it.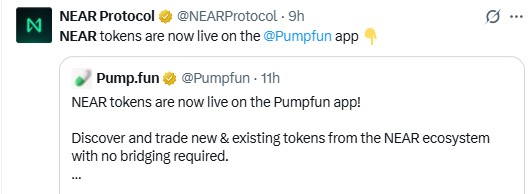
Source: NEAR Protocol official X account, Nov 4, 2026, 06:38 UTC.
The quoted Pump.fun post says traders can trade NEAR ecosystem tokens with no bridging required, meaning no cross-chain transfer.
If volume follows, the NEAR Pump.fun news adds a retail venue to the $581.069M 24h volume. Without that, the post stays a headline.
NEAR Price Forecast and Recent Performance
CoinGlass data, captured at 06:38 UTC, shows NEAR up 4.16% in 24 hours but down 19.98% over 30 days.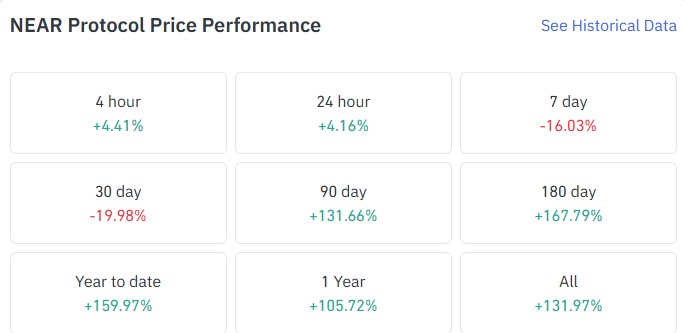
Source: CoinGlass, NEAR price performance, Nov 4, 2026, 06:38 UTC.
The 7-day move is down 16.03%, a small beside the 90-day gain of 131.66%. But sellers still lead the NEAR price forecast.
NEAR ETF Flows From the Bitwise NRR Fund
SoSoValue NEAR ETF data as of Nov 3, 2026, captured at 06:38 UTC, shows a $3.60M net outflow for the Bitwise NRR fund.
Source: SoSoValue, US NEAR spot ETF data, Nov 4, 2026, 06:38 UTC.
Cumulative net inflow stands at $81.22M. ETF net assets, the value of what the fund holds, are $60.87M. NRR trades at a 0.19% premium to its holdings.
One day of outflow isn't a trend, since cumulative ETF flows still sit positive. For wider context, see the latest crypto market news.
NEAR Whale Wallets and Holder Concentration
Etherscan NEAR token holders data, captured at 06:38 UTC, covers only the Ethereum-listed NEAR token, worth $16.79M.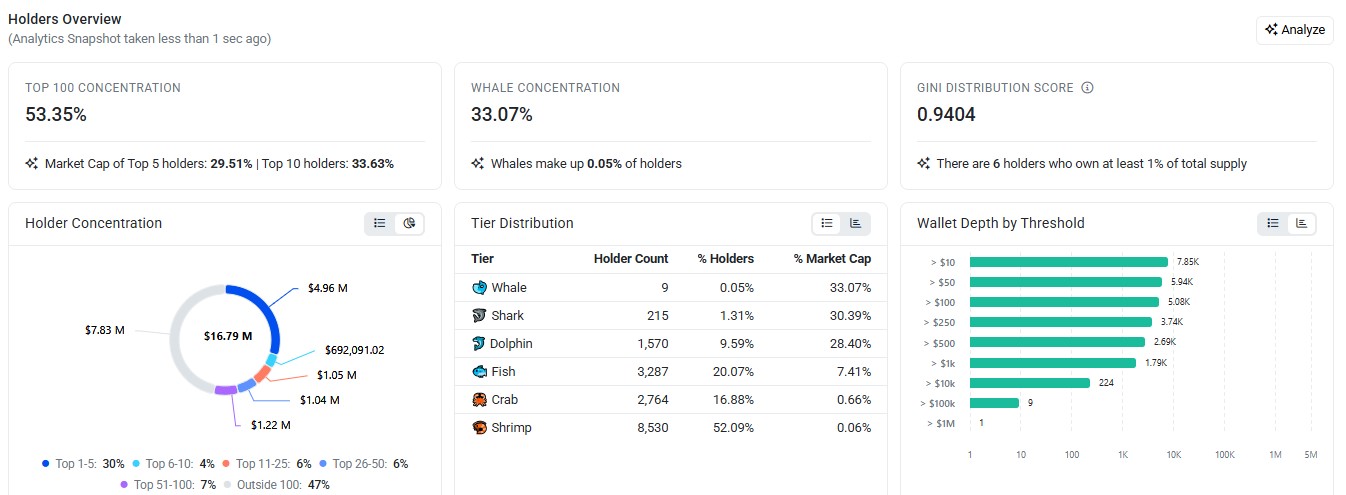
Source: Etherscan, NEAR token holders overview, Nov 4, 2026, 06:38 UTC.
The top 100 wallets hold 53.35% of that token. Whale wallets, the largest holders, number 9 and hold 33.07%.
Six wallets own at least 1% of supply. The largest, the Railgun Relay contract, holds 19.3436%.
NEAR Liquidation Data Shows Long Pain
Longs got hit hard. CoinGlass liquidation data, shows $3.11M wiped out in 24 hours.
Longs lost $2.23M and shorts $875.49K. Over the last 12 hours, Longs took the losses, with $1.46M against $552.15K.
Then the last hour flipped, with shorts losing $202.18K against $14.28K for longs. That's a short squeeze, forced buying by traders who bet on a drop.
NEAR Open Interest and Futures Volume
Open interest is the total value of futures contracts still open. CoinGecko lists NEAR perps open interest at $1.667B, captured 06:38 UTC.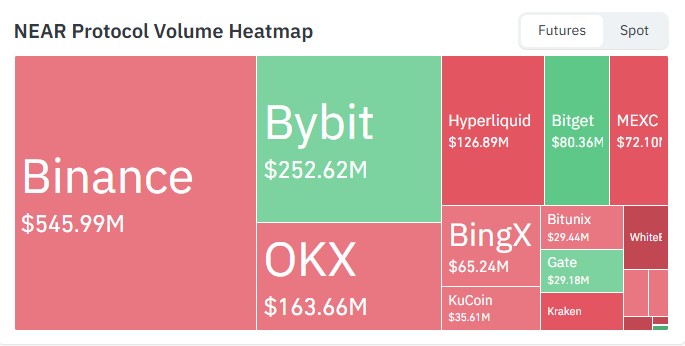
Source: CoinGlass, NEAR futures volume heatmap, Nov 4, 2026, 06:38 UTC.
CoinGlass NEAR futures data ranks Binance first at $545.99M. Bybit follows at $252.62M, a gap of $293.37M.
NEAR Technical Analysis: RSI and 50-Day EMA
The Binance 1D chart for NEAR/USDT on TradingView, captured at 06:38 UTC, frames this Near Price Prediction November 2026.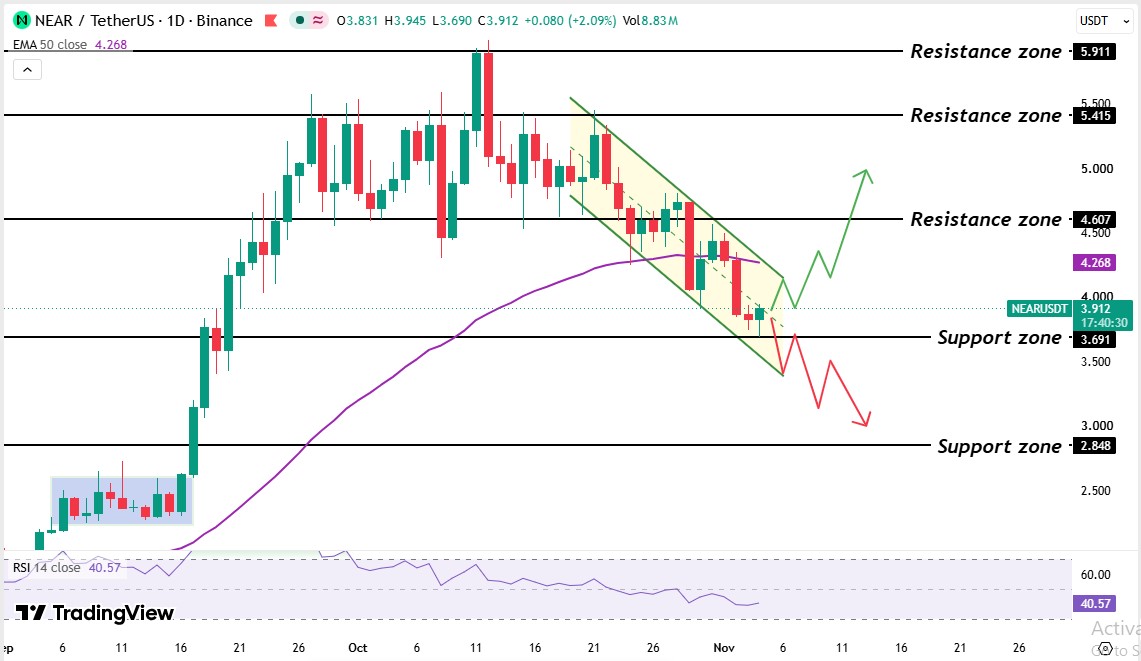
Source: TradingView, NEAR/USDT 1D, Nov 4, 2026, 06:38 UTC
NEAR did some consolidation in early September, then broke out of consolidation near 16 September. Through late September, the market tried many times to break the $5.415 resistance zone, but sellers defended it.
On 10 October the price broke the $5.415 level and tested the $5.911 level, but the price couldn't hold that level, and the price rejected that level.
From the third week of October, the price slid inside a falling channel, two falling parallel trendlines that hold price between a ceiling and a floor. A falling trendline, a line joining those highs, now caps NEAR price action.
Price lost the $4.607 resistance zone, then slipped under the $4.268 50 EMA, where sellers have taken over. The $3.691 support zone, where buyers have stepped in, held on to the latest candle.
Right now, the price trades above the $3.691 support zone, inside the falling channel
For the prior setup, see the NEAR floor breakdown analysis.
The NEAR 50-day EMA sits at $4.268. NEAR's $3.912 price trades 7.9% below it, and the latest daily candle trades below it too. And the channel ceiling sits near it.
The NEAR RSI reads 40.57 on the 14-day setting. Under 50, sellers hold the momentum edge. Above 30, oversold conditions haven't formed, so price has room to fall.
NEAR Support Levels and Resistance Levels
Level
Type
$2.848
Support
$3.691
Support
$4.268
50-day EMA
$4.607
Resistance
$5.415
Resistance
$5.911
Resistance
NEAR Bull, Base, and Bear Scenarios
Scenario
Trigger
Target
Invalidation
Bull
Daily candle trades above the $4.268 EMA level
$4.607 then $5.415
Trades below $3.691
Base
Holds $3.691 to $4.268
Range
Break of either level
Bear
Daily candle trades below $3.691
$2.848
Trades above $4.268
Regulatory delay, meaning slower approvals for more NEAR funds, keeps institutional demand thin. An ETF-flow reversal, meaning wider outflows from $3.60M, adds selling. Technical invalidation means a daily candle trading below $3.691.
NEAR Price Prediction November 2026: Expert Outlook
As per CoinGabbar analysis, the Near price prediction November 2026 leans cautious. RSI at 40.57 favors sellers. So does a $3.60M NRR outflow, with a price 7.9% below the EMA. But the floor held on the latest candle.
The daily 50-day EMA is the level to monitor. A daily candle trading above it turns the trend bullish, and a rejection there keeps sellers in control.
YMYL Disclaimer: This article is for informational and educational purposes only and should not be taken as financial or investment advice. Crypto markets are volatile
About the Author Dikshant Dibbey
Technical Analyst at coingabbar.com
Dikshant Dibbey is a crypto technical analyst with two years of knowledge and experience in the cryptocurrency and Web3 space. He has a strong interest in analyzing Bitcoin, altcoins, blockchain technology, and the evolving digital asset market. His focus is on understanding market trends, price movements, and technical indicators to help readers gain a clearer perspective on the crypto market. Through his content, Dikshant aims to simplify complex cryptocurrency concepts and provide readers with insightful, accurate, and easy-to-understand information.
 November 3, 2026
November 3, 2026
November 3, 2026
November 2, 2026
November 2, 2026
November 2, 2026
October 30, 2026
October 29, 2026
Frequently Asked Questions (FAQ)