USDT and USDC make up most of the stablecoin market. Both track the US dollar, but they are used in different ways, on different chains and by different participants. For a business, the choice of coin and network affects who can pay, what funds cost to move and how much operational work they create.
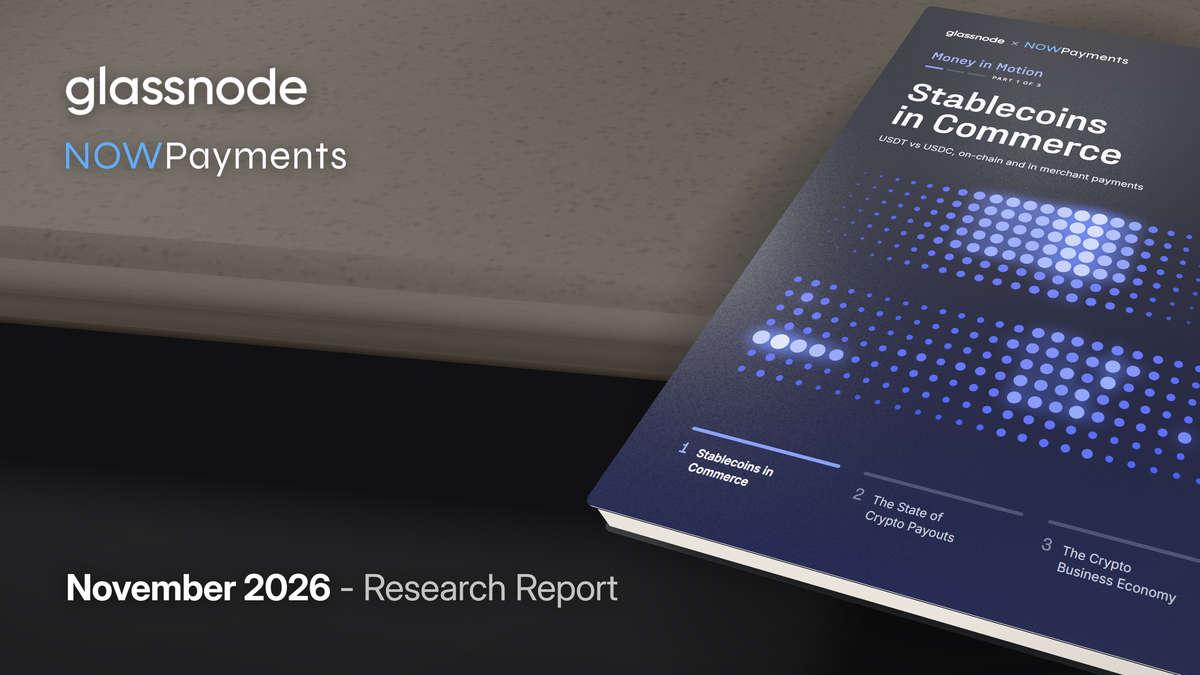
Stablecoins in Commerce, the first report in our Money in Motion series with NOWPayments, looks at how stablecoins are used for payments. It compares how USDT and USDC move on-chain with how merchants are paid in them, and gives practical advice to merchants that accept stablecoins.
One practical takeaway: the networks that move the most money on-chain are not always the ones merchants get paid on. USDT on Tron, BNB Chain and Ethereum brings in 86% of stablecoin pay-in value at NOWPayments. The three that move the most value on-chain, USDC on Base, USDC on Ethereum and USDT on Tron, bring in only 54%. On-chain users might be a better guide: they match where merchants get paid about twice as well as volume.
The full report is freely available for download in PDF format.
Most pay-ins arrive on Tron and BNB Chain, not where most value moves
On-chain volume can give conflicting signals about where merchants get paid: most stablecoin pay-in value arrives on networks that carry little of the value moved on-chain.
Pay-ins peak in the evening, hours after on-chain activity
For a merchant, the busy hours for payments are not the busy hours of the market, so support needs extra cover around the pay-in peak.
Stablecoins move more value than BTC and ETH combined
Even when every BTC transfer is counted, stablecoins move more value on-chain each day than BTC and ETH together.
What else the report covers
- The stablecoin market: supply by issuer, and why a transfer on a blockchain is not a payment.
- USDT and USDC on-chain: transfer sizes on each network, and how often each coin's supply changes hands.
- Merchant payments: how many coins and networks a merchant needs to reach most pay-ins, and how the stablecoin mix differs between trading, e-commerce, SaaS and iGaming merchants.
- Applying the findings: practical steps for choosing payment rails, planning around payment hours and counting the full cost of each route.
To explore the data and insights, download the full analysis in PDF format.
Disclaimer: This report does not provide any investment advice. All data is provided for information and educational purposes only. No investment decision shall be based on the information provided here and you are solely responsible for your own investment decisions. We urge users to exercise caution and discretion when utilizing these metrics. Glassnode shall not be held responsible for any discrepancies or potential inaccuracies.
- Follow us on X for timely market updates and analysis
- Join our Telegram channel
- For on-chain metrics, dashboards, and alerts, visit Glassnode Studio