Will Polkadot reclaim the $0.996 level, or is DOT headed for another leg down?
This Polkadot price prediction begins with DOT bouncing off a support level, a price where buyers have stepped in before, after a steep weekly drop. It follows an earlier Polkadot price analysis from this site. Sellers still hold the nearby resistance level, a price where rallies have stalled.
Polkadot Price Forecast: 24-Hour Market Snapshot
Metric
Value
Price
$0.8275
7-day change
-10.4%
Market cap
$1.418B
FDV
$1.418B
Circulating supply
1.712B DOT
Total supply
1.712B DOT
Max supply
2.1B DOT
Source: CoinGecko, DOT market data, captured Nov 13, 2026, 09:10 UTC
Per CoinGecko market data, DOT ranks 59th with a $1.418B market cap. FDV, or fully diluted valuation, is the value if every token were already in circulation.
Polkadot ETF Flows: $3.20M Total Inflow
SoSoValue ETF data shows $0.00 in daily net inflow for US DOT spot ETFs and $3.20M cumulative.
Source: SoSoValue, US DOT spot ETF data as of Nov 12, 2026, captured Nov 13, 2026, 09:10 UTC
Net inflow is money entering funds minus money leaving. Total net assets, the value of DOT the funds hold, stands at $8.35M, or 0.59% of market cap, on just $22.34K traded.
Wider ETF headlines in the latest crypto news feed can shift views on DOT fund demand. A flat $0.00 day adds no buying pressure, and funds this small can't steer price alone.
Polkadot Liquidation Data: $1.08M Wiped, 98% Longs
A liquidation is a forced exit from a leveraged trade once margin runs out. CoinGlass liquidation data shows $1.08M wiped from DOT futures in a day.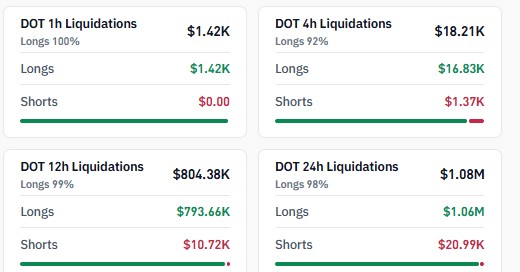
Source: CoinGlass, $DOT liquidation Data, captured Nov 13, 2026, 09:10 UTC
Longs are bets on a rising price, and shorts are bets on a falling price. Longs lost $1.06M, which is 98% of the total, while shorters lost just $20.99K.
Most of it hit earlier. About $786.17K was wiped between four and twelve hours ago. The last four hours added only $18.21K, and the last hour $1.42K, all longs.
When longs get liquidated, their positions are sold, which adds sell orders and can push the price lower. The slowdown in the last hour means forced selling has eased.
Polkadot Open Interest and Volume Data
CoinGlass futures data shows $135.95M in $DOT futures volume over 24h. Binance shows $40.84M in open interest, or 30.0% of the total.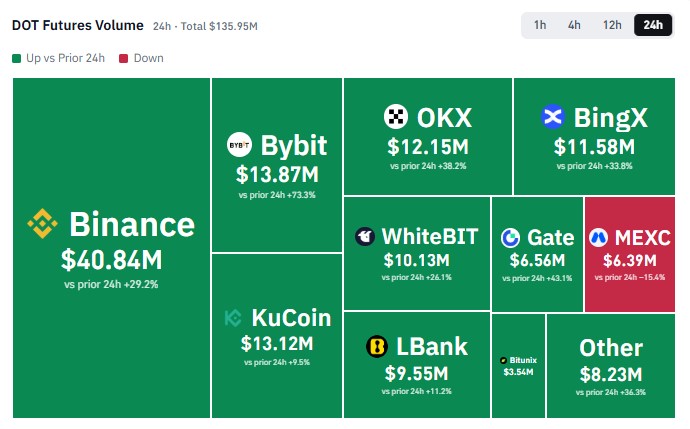
Source: CoinGlass, $DOT futures volume by exchange, 24h, captured Nov 13, 2026, 09:10 UTC
Bybit shows $13.87M. Bybit volume jumped 73.3%, which reads like fresh demand at first. But the price fell over the same stretch, so liquidated longs probably drove a good share.
Open interest, the total value of futures contracts still open, stands at $149.59M. Binance leads at $28.98M, ahead of Gate by $4.28M.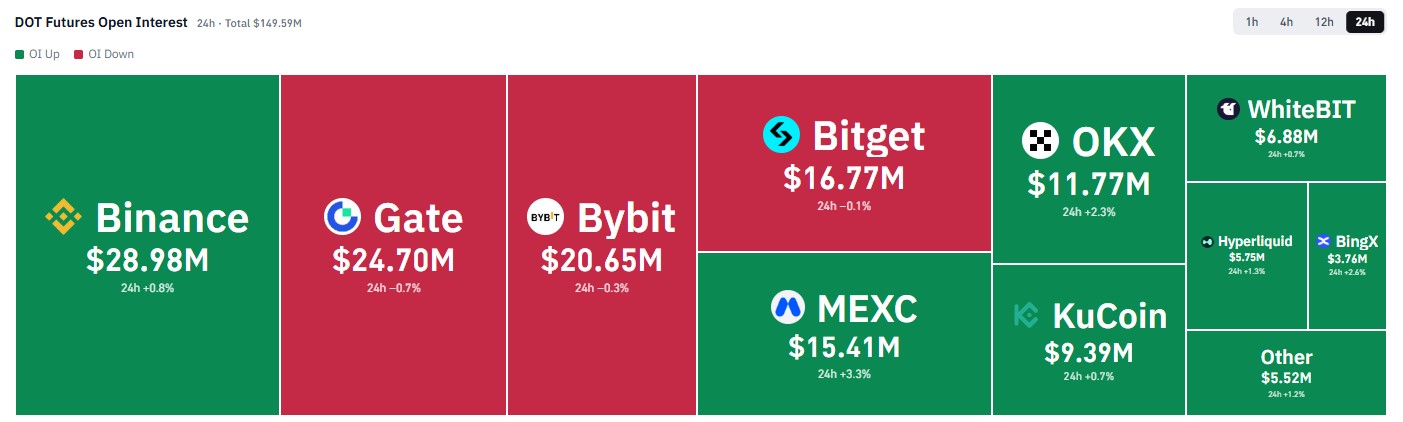
Source: CoinGlass, DOT futures open interest by exchange, 24h, captured Nov 13, 2026, 09:10 UTC
Gate slipped 0.7% while MEXC added 3.3%, so traders kept adding positions on some venues even as price fell.
Rising open interest during a drop means traders are adding positions, and that can fuel sharper swings either way.
Polkadot Technical Analysis: 50 EMA and RSI Levels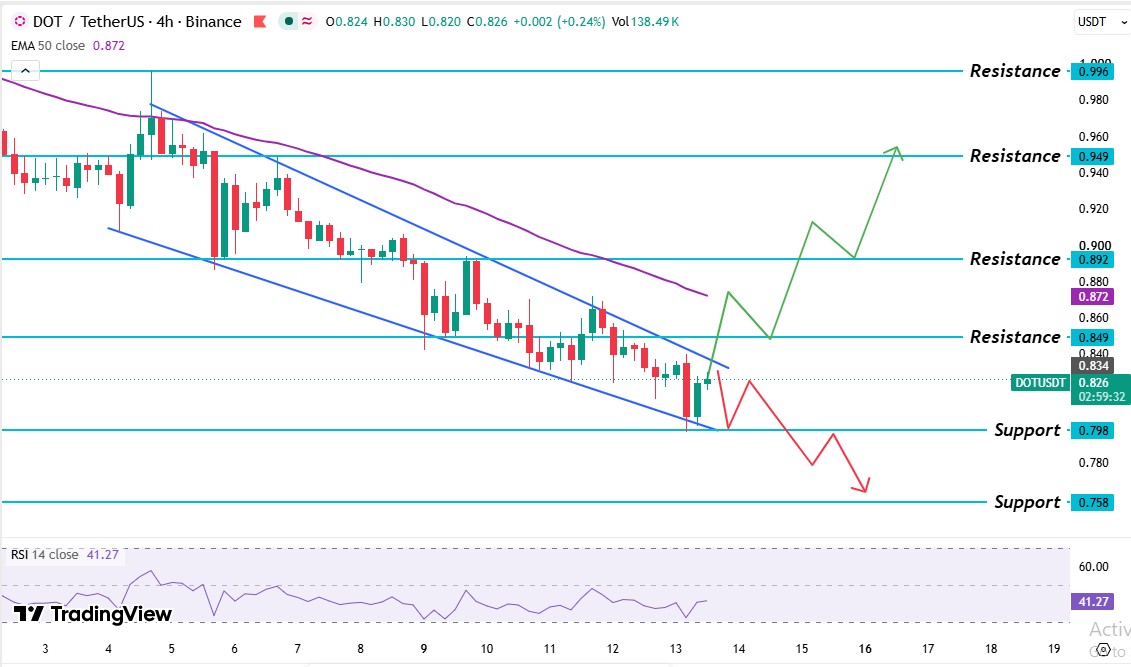
Source: TradingView, $DOT/USDT 4H chart with EMA 50 and RSI 14, captured Nov 13, 2026, 09:10 UTC
The Binance 4H chart for $DOT/USDT on TradingView frames this Polkadot price prediction.
Price traded sideways near the $0.949 resistance level until a $0.996 spike got rejected. $DOT then slid into a falling channel, a slope of lower highs and lower lows.
Sellers' higher rejections appear in an earlier DOT resistance analysis on this site. Buyers then failed at the $0.892 resistance level, and a final leg down tagged the $0.798 support level, where buyers need to step in.
Right now, $DOT trades inside a range, a band held between the $0.798 support level and $0.849 resistance level, and below the 4-hour 50 EMA.
The $DOT 4-hour 50 EMA sits at $0.872. $DOT's $0.8275 price trades 5.1% below it, so a real recovery needs a candle trading above the 50 EMA and the $0.849 level.
The $DOT RSI reads 41.27 on the 14-period setting. Under 50 means sellers hold the edge, and above 30 means oversold conditions haven't formed.
Polkadot Support and Resistance Levels: Seven levels to Watch
Level
Type
$0.996
Resistance level
$0.949
Resistance level
$0.892
Resistance level
$0.872
4-Hour 50 EMA
$0.849
Resistance level
$0.798
Support level
$0.758
Support level
The nearest levels are $0.798 below and $0.849 above.
Polkadot Price Forecast: Bull, Base, and Bear Scenarios
Scenario
Trigger
Target
Invalidation
Bull
Daily candle trades above $0.849
$0.872 then $0.892
Falls back below $0.849
Base
Price stays between $0.798 and $0.849.
Sideways trade inside that range
Daily candle breaks either level.
Bear
Daily candle trades below $0.798
$0.758 support level
Daily candle trades above $0.849
Risks to this Polkadot price prediction start with ETF flows turning negative, since funds hold just $8.35M. The technical risk cuts both ways. A daily candle under $0.798 breaks the bounce, while one above $0.849 breaks the bearish read.
Polkadot Price Prediction: Expert Outlook
According to CoinGabbar analysis, this Polkadot price prediction leans cautious, while $DOT trades below the $0.872 EMA. The RSI at 41.27 and 98% long liquidations back that view, and ETF flows of $0.00 add no offset.
A daily candle above $0.849 would be the first real sign of buyers. The $0.798 support level is the one to watch, since a daily candle trading below it confirms the bearish read and opens $0.758.
Disclaimer: This article is for information only and isn't financial advice. Traders should do their own research and risk only what they can afford to lose.
About the Author Dikshant Dibbey
Technical Analyst at coingabbar.com
Dikshant Dibbey is a crypto technical analyst with two years of knowledge and experience in the cryptocurrency and Web3 space. He has a strong interest in analyzing Bitcoin, altcoins, blockchain technology, and the evolving digital asset market. His focus is on understanding market trends, price movements, and technical indicators to help readers gain a clearer perspective on the crypto market. Through his content, Dikshant aims to simplify complex cryptocurrency concepts and provide readers with insightful, accurate, and easy-to-understand information.
 November 9, 2026
November 5, 2026
November 5, 2026
November 5, 2026
November 5, 2026
November 3, 2026
November 3, 2026
November 3, 2026
Frequently Asked Questions (FAQ)