Volatility gauges across asset classes are climbing in tandem while bitcoin, equities and precious metals sell off, a combination that points to a broad retreat from risk rather than trouble confined to any single market.
The VIX, which tracks the S&P 500's 30-day annualized implied volatility, has risen 52% this month and 81% this quarter to 29.5, its highest reading since March, according to data compiled by CoinDesk. The Volmex bitcoin volatility index has added 23% in November and 40% over the quarter to 52.2, while the gold volatility index is up 10% this month and 21% this quarter at 28.7.
Implied volatility indexes rise when demand for options picks up. Because options function as hedges, that demand typically swells when investors are anxious about the direction of prices.
The moves extend a pattern set in the third quarter, when bond and energy markets turned turbulent. The MOVE index, a gauge of Treasury market volatility, climbed 54% between July and September as yields rose, and an oil volatility index gained 21% amid Middle East unrest. Treasuries anchor global finance, so turbulence there tends to tighten financial conditions worldwide and push investors away from riskier holdings. The latest readings suggest that transmission is under way.
The nervousness in crypto runs against a thesis that gained traction earlier in the week: that capital would rotate back into bitcoin and digital assets once Anthropic completed its public listing. That did not happen. On Thursday, the day the artificial intelligence company began trading on Nasdaq, U.S. spot bitcoin ETFs recorded net outflows of more than $580 million, lifting the month-to-date figure to roughly $3.47 billion, according to SoSoValue.
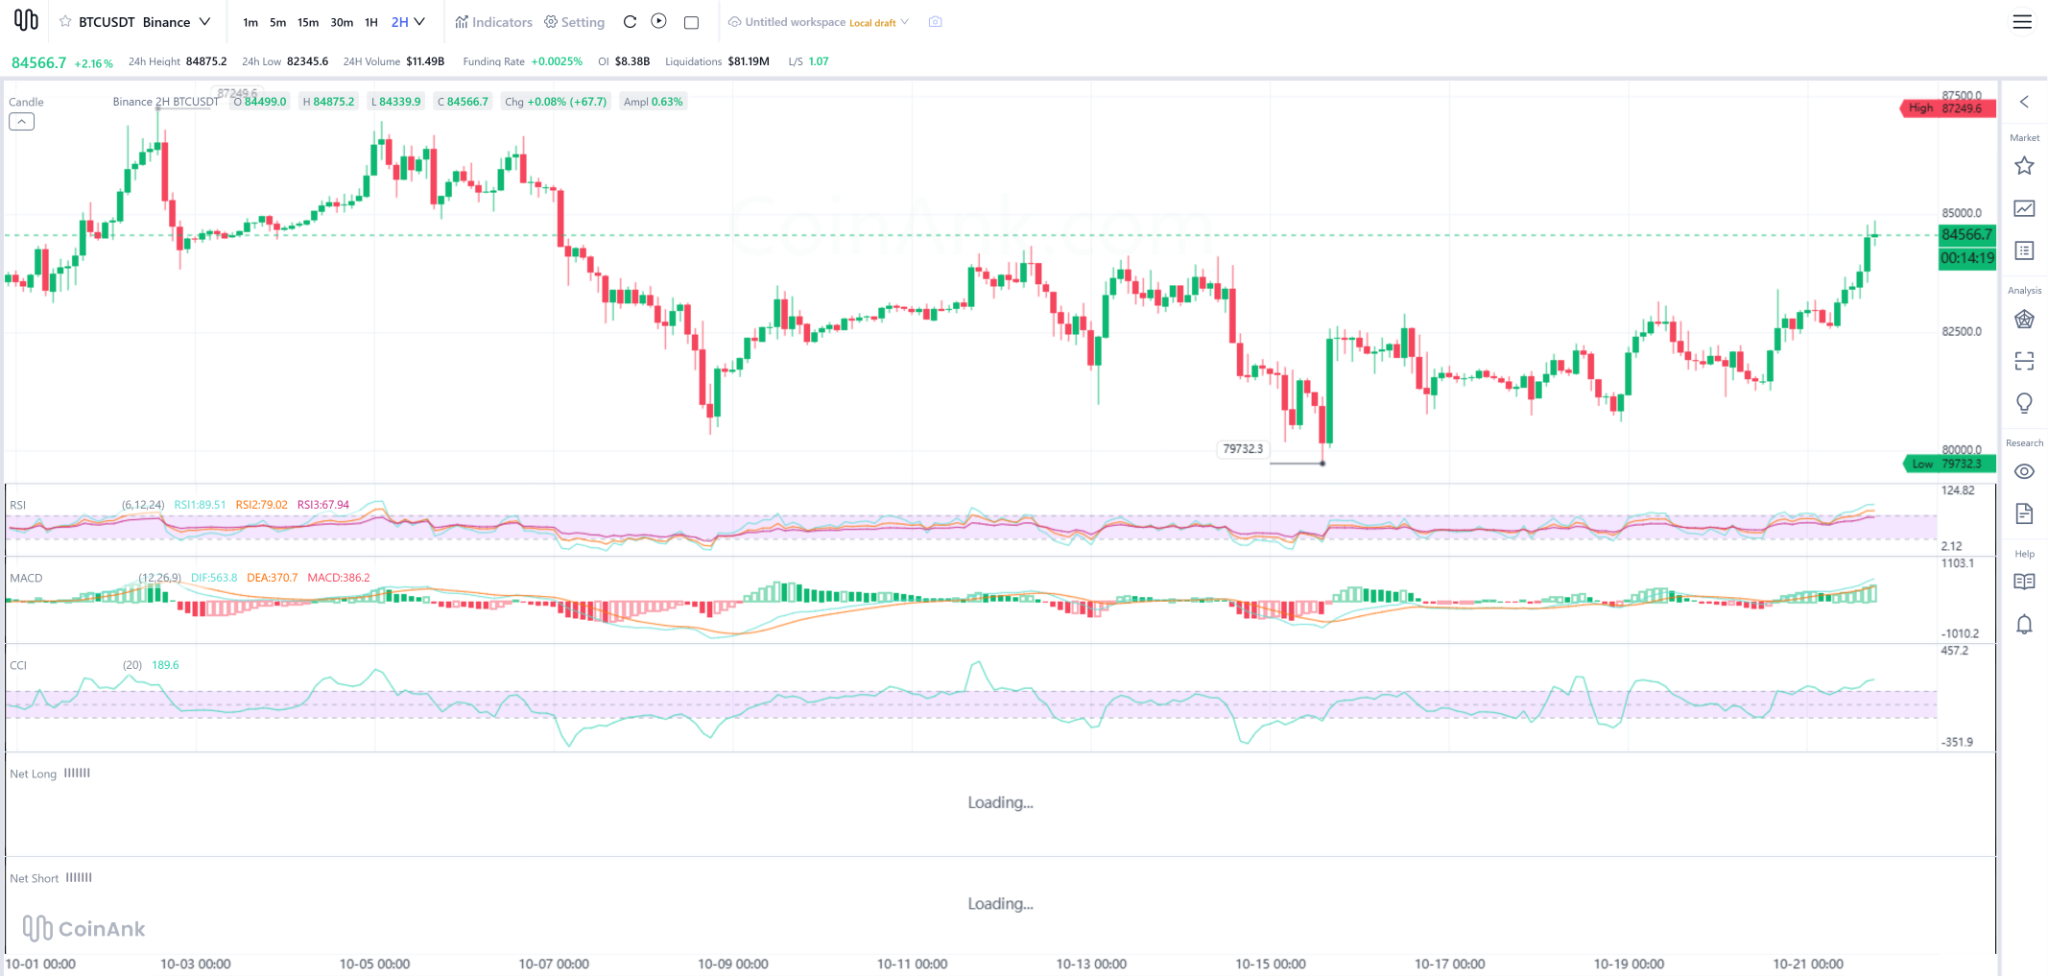
Bitcoin itself fell to about $61,300, its weakest level since early July, before recovering some ground. Ether, XRP and solana also declined. Gold dropped nearly 3% to $3,514, its lowest since early September, and bitcoin is down about 28% for the quarter.
Note: November and quarter-to-date figures reflect the readings cited in the volatility data. The MOVE figure covers July through September.
The timing matters because traditional markets close for the weekend while crypto trades around the clock. If anxiety persists into Saturday and Sunday, digital assets could absorb the brunt of the selling. Decentralized venues such as Hyperliquid, which list perpetual futures without expiry dates tied to conventional assets, may offer an early signal of sentiment while stock and bond markets are shut.
Rates remain the dominant macro force. Minutes from the Fed's late-October meeting showed a growing number of policymakers favoring higher borrowing costs in the face of sticky inflation, and some argued for an outsized 50 basis point increase in December. Fed Governor Christopher Waller reinforced that tone in a CNBC interview on Wednesday, saying the central bank should consider a half-point move in December and warning that inflation was "headed in the wrong direction."
Higher rates tend to erode the appeal of speculative assets. Bitcoin lost roughly 36% during the Fed's 2022-2023 tightening cycle, a stretch that also featured several high-profile crypto bankruptcies. Fed Governors Waller and Lisa Cook are both scheduled to speak Friday, giving investors fresh guidance on the policy path.
A softer message from the central bank could steady the mood. Should policymakers step back from recent hawkish language and signal less appetite for further increases, the dollar's advance could stall and both risk assets and dollar-denominated holdings could find a floor.
Treasury yields fell sharply Friday as an equity selloff drove money into havens, with the 10-year note at 4.989%, the 2-year at 4.713% and the 30-year at 5.361%. Global equities were set for a seventh consecutive daily decline, and Asian shares headed for their worst week since 2020.
Technical levels are also in focus for bitcoin. The immediate floor sits at $62,100-$62,300, where the Nov. 18 low of $62,101 and a daily Fibonacci support converge. Below that, $61,500-$61,800 and then the $59,800-$60,500 band have drawn buyers. The July 1 low of $57,877 stands as the 52-week low and the major line in the sand; a break there would put the weekly support near $55,000 in view. A move above $64,700 would be the first sign of relief.
Note: Levels reflect technical readings as of late Nov. 18.
For investors, the simultaneous rise in equity, crypto and gold volatility is the more consequential signal. Cross-asset stress of this kind has historically preceded broader de-risking, and it complicates the case for treating bitcoin as an uncorrelated hedge. With ETF flows still negative and the Fed's December decision unresolved, positioning across markets is likely to stay defensive until policymakers speak.
Once added, BigGo Finance appears first in Google Search Top Stories, so you get the broadest, most up-to-the-minute, and most comprehensive global financial news first.