Bitcoin fell nearly 10% in 24 hours to $55,684 on Nov. 21, pulling BTC▼$55,926.00 below $57,000 and back to its lowest level since September 2024. Understanding why Bitcoin is dropping requires looking at several forces converging at once: a broad sell-off sweeping through risk assets, crypto futures liquidations topping $2.40 billion in the same window, rising inflation-adjusted Treasury yields, a more hawkish Federal Reserve and heavily leveraged bullish positions all feeding the move.
- 🟢Bitcoin Breaks Below $57,000 as the Sell-Off Accelerates
- 🟠Macro Pressure and Leveraged Positions Drive the Move
- 🟠How Bitcoin Reached This Point
- 🔸Why the Drop Matters for Traders and the Market
- 🟠The Numbers Behind Bitcoin's Market Move
- ⚠️Risks After Bitcoin Falls Below $57,000
- ✨What Happens Next for Bitcoin and Crypto Markets
- 📖What the sell-off says about positioning
- ❓FAQ
Bitcoin Breaks Below $57,000 as the Sell-Off Accelerates
What happened to BTC?
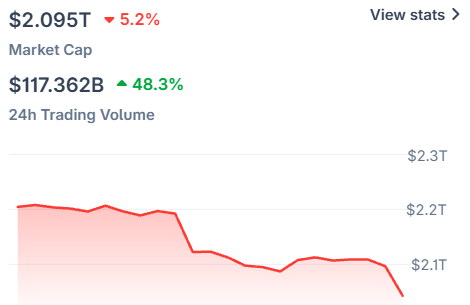
CoinGecko data showed Bitcoin at $55,684 at 06:06 UTC on Nov. 21, down 9.96057% over 24 hours. Market capitalization sat at about $1.12 trillion, with roughly $61.6 billion in trading volume across the day.
The intraday low varied by source. CoinDesk placed it at $56,302.69, while CryptoPotato reported $55,500. Either way, both readings broke below the $57,700 floor set on July 1.
Read More: BlackRock Bitcoin ETF Outflow Sets $541M Single-Day Record
How did the decline develop?
Bitcoin had dipped below $58,000 in June, recovered above $70,000 by mid-August and pushed near $90,000 in September. That advance briefly carried BTC above its 50-week simple moving average, giving some analysts reason to call a new uptrend. It didn’t hold.
Bitcoin hit $81,000 the day after the Nov. 5 U.S. elections, then shed about $25,000 in less than three weeks. The coin is now down 28% for the quarter and well off its peak above $126,000 from October of the previous year.
Macro Pressure and Leveraged Positions Drive the Move
Why are investors selling Bitcoin?
Higher real U.S. Treasury yields have made government bonds more competitive against assets that pay no yield, Bitcoin and gold included. Analysts pointed to that shift as a central driver of the broader risk-asset sell-off.
The Federal Reserve’s hawkish posture has compounded it. With borrowing costs elevated and safer assets offering a meaningful return, investors are trimming exposure to growth assets, crypto and other long-duration bets.
How did leverage amplify the fall?
CoinGlass data showed $2.40 billion in crypto futures positions liquidated across centralized and decentralized exchanges during the 24-hour period. Bitcoin futures alone accounted for more than $1 billion; Ether futures added $545 million.
The largest single liquidation was a $51.71 million Bitcoin long. When a leveraged long is forcibly closed, the resulting sale feeds more downward pressure and pushes other positions below their collateral thresholds — a cascade that made a large price move larger.
How Bitcoin Reached This Point
Which events added to the pressure?
CryptoPotato tied the worsening backdrop to the biggest Binance hack by dollar value, large ETF outflows, war uncertainty, the U.S. midterm election outcome and the Anthropic IPO. Each of those landed after Bitcoin’s recovery had already stalled near its September highs, leaving the market with less appetite for risk and less room to absorb forced selling.
Did other markets fall too?
Technology stocks, gold, copper and Asian equities all weakened alongside Bitcoin. The Nasdaq dropped more than 4% on Friday to its lowest level since April; gold fell to its lowest since September 2025.
Losses spread through the rest of crypto too. Ether slid to $1,550, BNB▼$508.99 dropped to $500 and XRP▼$0.8692 moved below $0.90. HYPE▼$56.58 and ZEC▼$697.24 both recorded double-digit losses during the same 24-hour window.
Why the Drop Matters for Traders and the Market
What does the liquidation wave show?
CryptoPotato counted 343,141 liquidated traders, with $2.2 billion of the nearly $2.4 billion total coming from long positions. The Defiant counted 343,889 liquidated traders and put longs at 92.6% of its rolling 24-hour total. The counts differ slightly, but both tell the same story: the market was leaning heavily bullish when Bitcoin broke below $60,000, and the unwind was fast.
What does the market structure show?
October spot trading volume fell 9.7% to $1.02 trillion. Real-world-asset perpetual volume rose 24.1% to $611 billion over the same period, and derivatives made up 79.1% of centralized-exchange volume. When derivatives dominate activity and bullish leverage is concentrated, a sentiment reversal can clear positions quickly — which is exactly what happened as prices broke through key levels.
The Numbers Behind Bitcoin’s Market Move
Even after the sell-off, Bitcoin remained the largest cryptocurrency by market cap. Its 24-hour trading volume of about $61.6 billion and the $2.40 billion in futures liquidations together show how much capital was moving as the price broke lower.
The current price sits below the July 1 level of $57,700 and far below the $81,000 reached after the Nov. 5 elections. This isn’t one bad session — it extends a decline that was already underway.
Risks After Bitcoin Falls Below $57,000
What could worsen the decline?
If real Treasury yields keep rising or the Fed holds its hawkish course, assets that depend on liquidity and risk appetite remain under pressure. Bitcoin fits both descriptions. Another wave of forced selling could deepen the move if bullish leverage is still concentrated in the market — the recent liquidation totals show how fast a drop can spread through futures when longs dominate.
What should traders watch carefully?
The immediate question is whether Bitcoin can stabilize after losing the July 1 floor at $57,700. Continued liquidations, renewed weakness in equities or another leg lower in gold would all keep the risk-off backdrop alive.
The different intraday lows and liquidation counts reflect the figures cited by the respective outlets. Traders should treat them as reported market readings from the sell-off rather than a single uniform exchange print.
What Happens Next for Bitcoin and Crypto Markets
Which price level is in focus?
With the July 1 low now behind it, Bitcoin’s trading range is under fresh pressure. Whether selling continues depends on how much leveraged exposure remains after the first wave of liquidations, and on whether risk assets more broadly find a floor.
A sustained stabilization would require the market to absorb those forced closures while Treasury yields and Fed policy signals shift. A further decline would put the concentration of remaining bullish leverage and the health of crypto derivatives markets back in the spotlight.
What wider signals matter now?
Investors are watching whether the Nasdaq, gold, copper and Asian equities recover from their weekly losses. Bitcoin fell alongside all of them, so a genuine improvement in risk appetite could shift crypto positioning — even if it wouldn’t by itself confirm that the Bitcoin sell-off is over. The Fed’s policy direction remains the biggest open question; no specific decision or date has been identified, so the market’s response to that path is the immediate issue to track.
What the sell-off says about positioning
The scale and direction of the liquidations make it clear that traders had built substantial exposure to a continued rally. Of the nearly $2.4 billion liquidated in the daily window, $2.2 billion came from long positions; the separate rolling measure put the long share at 92.6%. Both show the same imbalance: bullish bets bore most of the forced closures as prices broke lower.
The largest reported individual loss was close to $52 million — a Bitcoin long in the BTC/USDT▼$0.9987 pair on Binance. A single position of that size shows how exposure was concentrated in leveraged bets. Once collateral could no longer support those trades, forced closures converted unrealized losses into market orders and added supply during an already steep decline.
The backdrop had also changed from the one that supported the earlier rebound. Bitcoin’s climb above $70,000 in mid-August and near $90,000 in September had raised expectations that the July low was behind it. The September advance was rejected, and the market then absorbed a series of pressures rather than a single catalyst. By the time BTC fell below $60,000, the case for a new uptrend had already unraveled.
Risk aversion was visible well outside crypto. Technology shares, gold, copper and Asian equities all weakened through the week, and the Nasdaq’s Friday drop took it to its lowest level since April. Gold reached a low not seen since September 2025. That breadth matters for crypto because investors were cutting exposure across multiple asset classes at once as real yields rose and the Fed signaled a harder line.
Crypto’s internal market mix adds context. Spot trading volume was lower in October even as real-world-asset perpetual trading expanded and derivatives claimed a larger share of centralized-exchange activity. In a market where derivatives account for 79.1% of that volume, a one-sided build-up in leveraged positions leaves prices exposed when sentiment turns. That helps explain why the adjustment was so fast once the market broke through major levels.
FAQ
When did Bitcoin last trade at these levels?
Bitcoin last traded below this area in September 2024, according to the market coverage of the move.
How much did Bitcoin fall in the 24 hours covered by the market data?
Bitcoin fell 9.96057% over 24 hours, which is approximately a 10% daily decline. The market data placed BTC at $55,684 when it was fetched on Nov. 21.
How many crypto traders were liquidated during the sell-off?
CryptoPotato counted 343,141 liquidated traders, while The Defiant counted 343,889. The difference reflects the separate liquidation figures cited in coverage of the same 24-hour market move.
What caused the leveraged liquidation cascade?
Bitcoin’s decline pushed leveraged bullish positions below their collateral requirements, forcing exchanges to close them. Those closures added selling pressure, which could trigger further liquidations as prices moved lower.
What price did Bitcoin reach after the U.S. elections on Nov. 5?
Bitcoin reached $81,000 the day after the Nov. 5 U.S. elections. It then lost about $25,000 in less than three weeks before reaching the latest lows.
Why is Bitcoin falling with stocks and gold?
The sell-off hit several risk-sensitive markets simultaneously, including technology stocks, copper, Asian equities and gold. Analysts pointed to higher inflation-adjusted Treasury yields and a more hawkish Federal Reserve as the common pressure points.
Can Bitcoin go back above $57,000?
A recovery would require Bitcoin to reclaim the level it just lost. Liquidations, Treasury yields, Federal Reserve policy and broader risk appetite are the main factors to watch, but the available coverage does not establish a confirmed bottom or a future price target.
This article is for information only and is not financial advice.
Related Articles
Bitcoin Reclaims $81,000 as Fed Hike Bets Fade, Zcash Explodes 16%
Bitcoin rose above $81,000 in Asia trade on Friday after easing concerns that the Federal Reserve...
MARA Reports Record $1.3B Loss in Q1 2026
The loss more than doubled from the previous year. Revenue fell 18%, missing Wall Street...
What Is Bio Protocol Crypto? Why This AI-Powered DeSci Token Is Exploding in 2026
For readers asking what is Bio Protocol crypto, it is a decentralized science infrastructure that...
Strategy Buys $101M in Bitcoin After Small But Loud BTC Sale
Strategy buys 1,550 BTC▼$55,926.00 as its total holdings rise to 845,256 BTC, according to a June...
Algorand Price Prediction: Is ALGO Setting Up for Another 150% Rally?
Algorand is back in price talk after ALGO▼$0.0701 rallied through September and challenged the...
🏧What Is Crypto ATM: How Bitcoin ATMs Work and Where to Find Them
Those occasions when you look at a kiosk located at a gas station, convenience store, or a mall and...