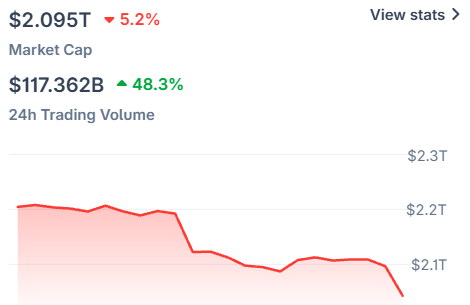
Bitcoin fell 9.96% in 24 hours to $55,684 at 06:06 UTC on November 21, breaking below $60,000 as reports put crypto liquidations between $1.76 billion and almost $2.4 billion—a move that explains why bitcoin is dropping. CoinGecko data showed BTC▼$55,926.00 at $55,684, while the liquidation estimates include losses on crypto-platform bets tied to technology stocks.
The sharp drop follows a decline from $81,000 on November 6 to below $56,000 less than three weeks later. Traders now face renewed selling pressure after Bitcoin broke through a level analysts had identified as the lower edge of its recent trading range.
- 🟣Bitcoin Breaks Below $60,000 as Liquidations Mount
- 🔑Long Positions Accounted for Most Forced Sales
- 🧩Stock-Linked Bets Added to Crypto-Platform Losses
- 💡Bitcoin's Slide Followed a Steep Reversal
- 🔹Will Bitcoin Go Back Up? What Bitcoin Traders Will Watch Next
- ❓FAQ
Bitcoin Breaks Below $60,000 as Liquidations Mount
Bitcoin fell to $55,500 on Saturday morning, its lowest price since September 2024, according to CryptoPotato. The drop also put BTC below $57,700, the floor recorded on July 1. Bitcoin had rebounded above $70,000 in mid-August and approached $90,000 in September before the advance stalled.
CoinGecko’s 06:06 UTC reading put Bitcoin at $55,684, down 9.96% over 24 hours. The reports’ liquidation totals vary: BeInCrypto put the 24-hour wave at $1.76 billion, while CryptoPotato cited almost $2.4 billion and The Defiant reported $2.38 billion.
Those figures describe the same broad episode but are not identical snapshots. The reporting gives different totals, trader counts and price readings, so they should be read as estimates from separate market-data accounts rather than added together. The key shared signal is the scale of forced closures as Bitcoin fell through the $60,000 area and then the July 1 low.
The move below $57,700 matters because that level had previously marked a low that buyers managed to leave behind. The subsequent recovery carried Bitcoin above $70,000 in August and close to $90,000 in September, but that rally did not hold. By November 21, the market had surrendered those gains and pushed through the earlier floor, extending the reversal beyond a routine test of the range’s lower edge.
The intraday prices also show how quickly the market was moving. Bitcoin was reported at $59,500 in comments about the risk-off move, at $58,558 in the stock-linked liquidation coverage, and at $55,500 in the account of the Saturday morning low. CoinGecko’s later snapshot at 06:06 UTC placed it at $55,684. These are readings at different points in a fast decline, not competing prices for one exact moment.
Long Positions Accounted for Most Forced Sales
Leveraged buyers bore the largest share of the damage. Long positions made up 92.6% of the rolling 24-hour total cited by The Defiant; CryptoPotato put long liquidations at $2.2 billion.
The reports also counted different numbers of traders: 343,889 in The Defiant’s account and 343,141 in CryptoPotato’s. CryptoPotato said the largest single liquidation was nearly $52 million on Binance in the BTC/USDT▼$0.9987 market.
The long-heavy split is consistent with a steep downward move catching traders positioned for higher prices. As losses grow, an exchange can close a leveraged position when the trader can no longer cover it. Those forced sales add orders to an already falling market, and the closures can cluster when prices cross levels at which many positions become vulnerable.
The liquidation count is not a count of all market participants who sold Bitcoin, nor does it measure the number of unique investors affected by the entire price decline. It records reported forced position closures during a defined period. The differing totals in the coverage reflect separate readings of that activity; both accounts nonetheless show that the liquidations were unusually broad and concentrated heavily among long positions.
The largest reported closure was tied to BTC/USDT on Binance, linking the biggest individual event directly to Bitcoin rather than to the stock-linked contracts. At the same time, the total across crypto platforms included a wider mix of positions. That distinction matters when interpreting the headline figure: Bitcoin was the central driver of the price story, but it was not the only asset represented in the liquidation data.
Stock-Linked Bets Added to Crypto-Platform Losses
Crypto exchanges now host perpetual futures linked to individual stocks and funds. These contracts track share prices, do not expire and trade around the clock, so losses in technology-linked positions can appear in the same liquidation totals as crypto bets.
BeInCrypto said about $36 million in SOXL positions were liquidated, roughly twice the XRP▼$0.8692 total in its account. SanDisk and Nvidia positions each saw close to $28 million in liquidations. The article linked the broader risk-off move to weakness in chip and technology stocks, not to a single cause for Bitcoin’s decline.
SOXL tracks semiconductor stocks with triple leverage, making its reported liquidation total notable in a story otherwise centered on Bitcoin. The contract lets traders take a leveraged view of a fund’s share-price performance through a crypto platform. When the underlying technology shares weaken, the resulting losses can therefore show up in the platform’s crypto-market liquidation reporting even though the position is not a direct BTC bet.
The stock-linked positions were not a small detail in the reported mix: SOXL alone contributed about $36 million, while the Nvidia and SanDisk positions each approached $28 million. Those amounts sit alongside liquidations in Bitcoin and other crypto assets in the aggregate figures. They do not establish that stock contracts caused Bitcoin’s decline, but they show why the overall liquidation total cannot be treated as a Bitcoin-only measure.
Nvidia fell behind Alphabet to become the fourth most valuable U.S. company on Friday, with Alphabet valued at about $3.25 trillion and Nvidia at roughly $3.03 trillion, according to Companies Market Cap figures cited by BeInCrypto. Nvidia shares also hit their lowest level since June 2025. STS Digital CEO Maxime Seiler described the market as a one-sided risk-off move led by AI and technology stocks, with Bitcoin at $59,500, in comments to Forbes.
“This is a one-sided risk-off, with AI and tech leading it and Bitcoin down at $59,500,” Seiler said. His description connects the technology-share decline with the pressure in crypto, while also making clear that Bitcoin was already falling during the move. The available reporting does not identify one trigger that explains the full decline or quantify how much of Bitcoin’s loss came from stock-market weakness.
Nvidia’s position in the market also changed during the selloff: it moved behind Alphabet in U.S. company value as the chipmaker’s shares reached their lowest point since June 2025. That is a specific sign of weakness in the technology trade, not evidence by itself that every crypto position was driven by the same event. Crypto traders holding stock-linked contracts faced the direct share-price exposure, while Bitcoin holders faced the broader market repricing and liquidation pressure.
Bitcoin’s Slide Followed a Steep Reversal
Bitcoin had reached $81,000 a day after the November 5 U.S. elections, then lost about $25,000 in less than three weeks. CryptoPotato also pointed to ETF outflows, uncertainty around war, the U.S. midterm-election outcome, the Anthropic IPO and Binance’s largest hack by dollar value as pressures cited during the broader market decline.
The November move followed a rally that had taken BTC well above the July 1 low. It climbed past $70,000 in mid-August and approached $90,000 in September, but was rejected near that later high. The reversal from $81,000 after the November 5 election extended the retreat: less than three weeks later, Bitcoin was below $56,000 and trading beneath both $60,000 and the earlier $57,700 floor.
The list of pressures cited during the decline spans market flows, political uncertainty, geopolitical uncertainty and company news. ETF outflows were cited alongside uncertainty around war and the outcome of the U.S. midterms. The Anthropic IPO and Binance’s largest hack by dollar value were also mentioned as developments weighing on sentiment. These are factors reported during the broader selloff, not a ranking of their effects or proof that any one item directly produced the November 21 low.
That distinction is important because the decline unfolded over weeks rather than in a single isolated session. Bitcoin’s retreat from the November 6 area coincided with several concerns, while the break below the range floor brought a fresh wave of liquidations. The sources describe both the broader backdrop and the immediate mechanics, but do not give a numerical attribution of the price move to any particular news event.
Other major tokens were also under pressure. CryptoPotato said Ethereum fell to $1,550, BNB▼$508.99 to $500 and XRP below $0.90, while HYPE▼$56.58 and ZEC▼$697.24 recorded double-digit losses over the preceding day.
The weakness across those assets shows that the move was not limited to Bitcoin. Ethereum, BNB and XRP each reached the reported levels as the market sold off, and HYPE and ZEC posted double-digit daily losses. The figures provide a snapshot of the breadth of the decline; they do not indicate that every token moved for the same reason or by the same amount.
Bitcoin’s fall nevertheless remained the focal point of the liquidation reports. It broke below a price zone watched by analysts, set a low not seen since September 2024, and accounted for the largest single reported liquidation through a BTC/USDT position. Stock-linked contracts and other token liquidations widened the total beyond BTC, while the Bitcoin price action supplied the clearest marker of the market’s deterioration.
Will Bitcoin Go Back Up? What Bitcoin Traders Will Watch Next
Katie Stockton of Fairlead Strategies told CNBC that the bottom of Bitcoin’s trading range sat just below $60,000. With BTC now beneath that area, traders will watch whether bitcoin will go back up from these levels and whether buyers can regain ground, or if the decline triggers another wave of forced selling.
The immediate question is whether the market can recover the area below $60,000 that Stockton had identified as the range floor. A move back above it would put the break in a different context; remaining below it would leave the prior support zone overhead as a level traders have to reclaim. The sources do not give a scheduled event or a specific price target for that test.
There is also a difference between a temporary bounce and a sustained recovery. A short-lived move above the former range floor would not, by itself, show that the selling pressure had ended. Traders will be looking at the response around the level alongside liquidation activity: if leveraged positions continue to be closed as price falls, forced orders could prolong the move; if that activity subsides, one source of immediate selling pressure would be reduced.
The reported liquidation numbers provide a measure of how many positions were forced out over the preceding 24 hours, but do not say how many remain exposed or where their liquidation levels sit. That leaves the next leg difficult to infer from the totals alone. The levels and readings reported here establish what has already happened; the market’s ability to hold or recover ground will determine whether the breach becomes a deeper breakdown or a failed move below support.
Technology shares are another near-term signal. BeInCrypto noted that stock-linked perpetual futures connect crypto-platform liquidations with moves in chip stocks; continued weakness there could add to liquidation activity, while stabilization would ease that particular source of pressure.
The stock-market connection has two separate channels. Chip-share weakness can directly pressure traders holding linked perpetual contracts, as the SOXL, Nvidia and SanDisk liquidations illustrate. It can also coincide with a wider risk-off mood, the framing Seiler used for the move. Stabilization in chip shares would address the first channel, but it would not guarantee that Bitcoin or other crypto assets recover, since the reporting also cites ETF outflows and several other sources of uncertainty.
For now, there is no single announced catalyst or scheduled decision in the source material that would settle the market’s direction. The next developments to monitor are the response around the former trading-range floor, whether another wave of long liquidations follows, and whether technology shares stop extending their decline. Those observations can clarify whether the same pressures remain active, but they do not amount to a forecast for Bitcoin’s next price move.
The price and liquidation readings are snapshots from November 21, not a confirmed account of what happened after the reporting. The market can move quickly, and the quoted totals use different data snapshots. Any later assessment will need to distinguish new trading from these reported 24-hour figures and account for the separate Bitcoin, other-token and stock-linked positions in the mix.
FAQ
When did Bitcoin fall below $60,000?
Bitcoin was below $60,000 by Saturday morning, November 21, 2026. CoinGecko recorded BTC at $55,684 at 06:06 UTC.
How much of the liquidation wave came from long positions?
Long positions accounted for 92.6% of the rolling 24-hour liquidation total cited by The Defiant. CryptoPotato separately put long liquidations at $2.2 billion.
Why were stock bets included in crypto liquidation totals?
Crypto platforms offer perpetual futures tied to stocks and funds, including SOXL, Nvidia and SanDisk. Forced closures of those positions contributed to the liquidation totals reported on crypto markets.
What price level were analysts watching before the break?
Katie Stockton of Fairlead Strategies told CNBC that the bottom of Bitcoin’s trading range was just below $60,000. BTC’s fall beneath that zone has put the market’s response around the level in focus.
What could add to selling pressure from here?
Further weakness around the area below $60,000 could expose leveraged long positions to more forced selling. Continued weakness in chip shares could also feed through stock-linked perpetual futures on crypto platforms.
This article is for information only and is not financial advice.
Related Articles
Bitwise: Financial Advisors Prefer Stablecoins and Tokenization Over Bitcoin
Bitwise CIO Matt Hougan held eight meetings with financial advisors in a single day—a record in...
Strategy Unveils Bitcoin Bank Adoption Index — Average Integration at 32%
Strategy has published an index measuring bitcoin adoption among the world’s largest banks and...
Bitcoin Reclaims $81,000 as Fed Hike Bets Fade, Zcash Explodes 16%
Bitcoin rose above $81,000 in Asia trade on Friday after easing concerns that the Federal Reserve...
Pantera Pushes Bitcoin Treasury Firm Satsuma to Sell Reserves: Report
Crypto VC giant Pantera is reportedly pushing Satsuma to unwind its Bitcoin treasury, selling about...
Bitcoin Mining Pool Poolin Files Bankruptcy With $173M Debt
Former Bitcoin mining pool giant is seeking to sell two Texas sites for at least $52 million after...
Zcash Proposes New Shielded Pool. ZEC Price Rises on June 8
Zcash developers are considering launching a new shielded pool to restore trust in the project...