BTC trades near $61,861, down 2.30% in 24 hours and about 51% below its $126,198 high.
U.S. spot ETFs saw $582.19 million in net outflows on Nov. 19.
Daily RSI is near 20, a deeply oversold reading.
The Fed is priced for a hike on Dec. 9, with 99.1% odds.
BTC trades near $61,861, down 2.30% in 24 hours and about 51% below its $126,198 high.
U.S. spot ETFs saw $582.19 million in net outflows on Nov. 19.
Daily RSI is near 20, a deeply oversold reading.
The Fed is priced for a hike on Dec. 9, with 99.1% odds.
Bitcoin has fallen to its lowest level in more than four months. BTC trades near $61,861 and is on track for a seventh straight weekly loss.
That would be the second-longest losing streak on record. Only the nine-week slide in 2022 was longer.
Tech stocks also gave up early gains after Anthropic's Nasdaq debut. That added to the risk-off mood.
Sellers are not letting up. ETF money keeps leaving, longs keep getting wiped out, and the Fed may raise rates again.
ETF outflows hit a record for IBIT
Demand for Bitcoin through U.S. spot ETFs has dropped fast. Net withdrawals reached $582.19 million on Nov. 19, almost double the $306.42 million seen a day earlier.
BlackRock's IBIT lost $541.08 million. That is its largest daily outflow since launch.
Fund
Nov. 19 net flow
BlackRock IBIT
-$541.08M
Fidelity FBTC
-$45.87M
ARK 21Shares ARKB
-$31.29M
Grayscale GBTC
-$13.88M
Morgan Stanley MSBT
+$49.60M
WisdomTree BTCW
+$327.77K
Total
-$582.19M
November outflows now stand at $3.47 billion, with withdrawals in 12 of 14 sessions. Nearly $1.13 billion left in the last three days alone.
Total net inflows since launch are still about $53.51 billion. Assets sit at $76.55 billion, or 6.13% of the market cap.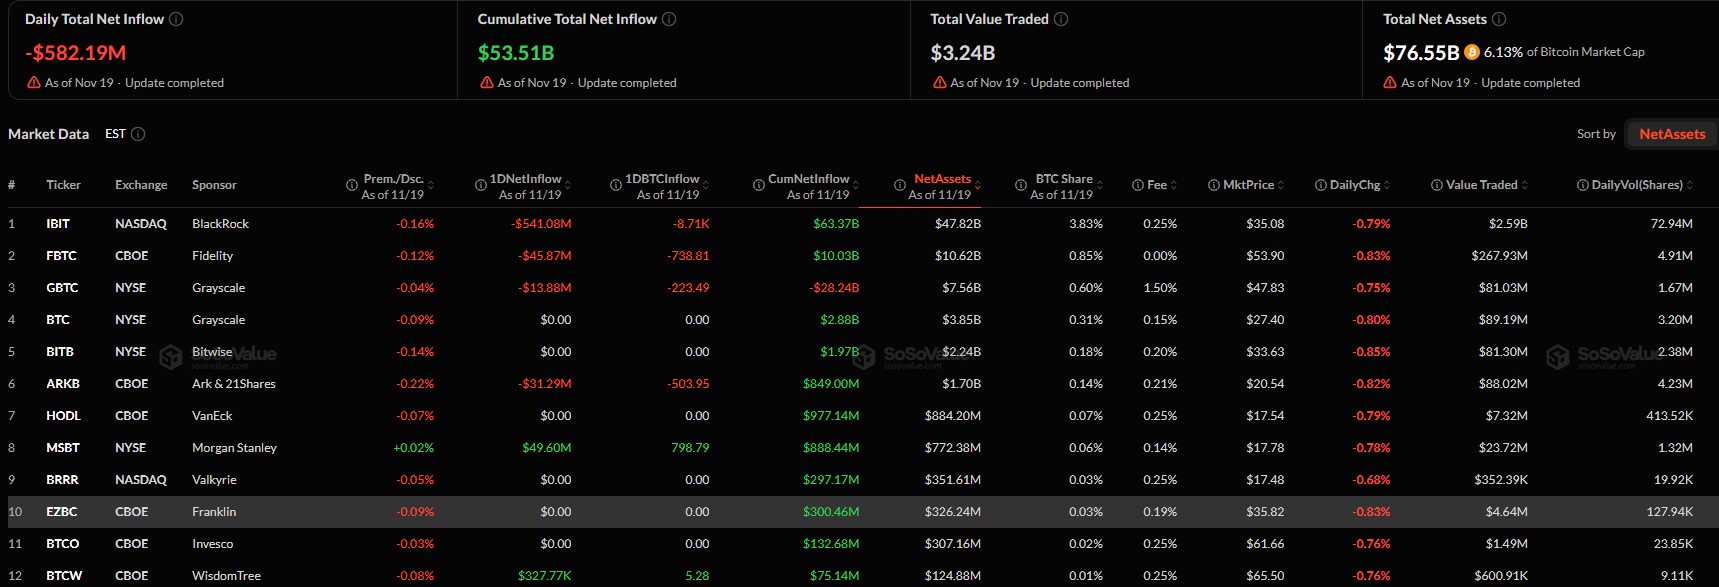
Futures show pain for longs
BTC futures volume is $82.88 billion, up 24.76%. Open interest is near $42.02 billion. The funding rate is only 0.0023%, so traders are not overly bullish.
The 24-hour range is $61,255.6 to $64,056.0. Liquidations hit $202.91 million, with longs at $167.06 million and shorts at $35.84 million.
The Fear and Greed Index is at 11, which means extreme fear.
Fed hike odds near 100%
CME FedWatch shows a 99.1% chance of a 25 basis point hike on Dec. 9. That would lift the rate from 375-400 to 400-425 basis points.
Odds were 72.5% a month ago, 85.5% a week ago and 93.5% a day ago. Higher rates tend to hurt risk assets, and BTC has felt it.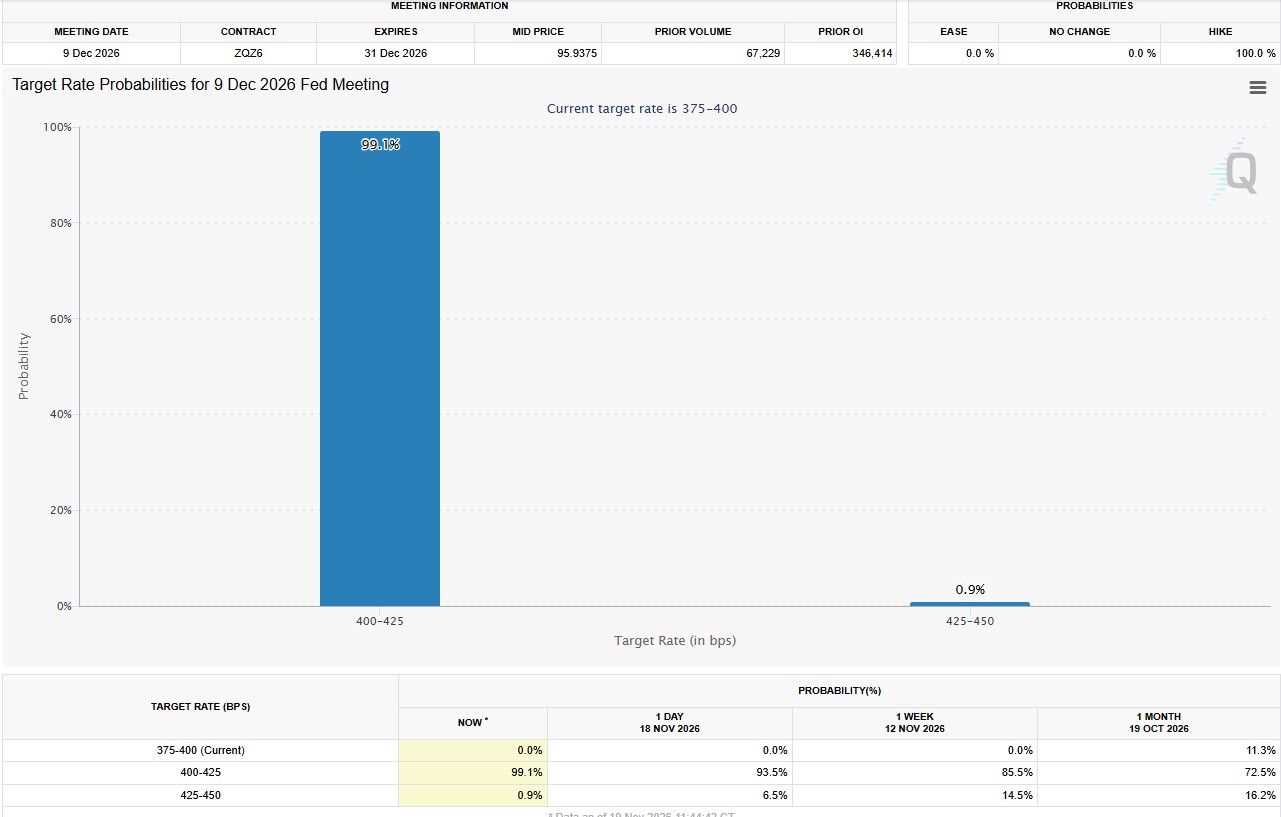
Brandt and Schiff warn of deeper losses
Peter Brandt shared a cycle chart. He says every bull phase ended with a drop of at least 75%.
His chart covers 2011, 2013, 2017 and 2021. The bull phases lasted 938, 1,526, 1,421 and 1,463 days. It marks $37,629, about a 70% fall, as a possible low.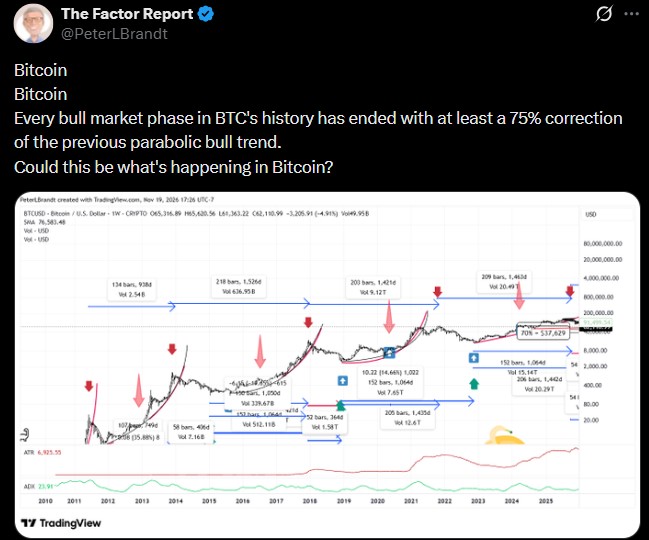
Peter Schiff says the next crash will be "much bigger" than 2008. He thinks gold should not have fallen, while Bitcoin has not fallen enough.
He calls gold's drop a chance to buy and BTC's a chance to sell. He also says falling gold signals deflation, with stocks and real estate set to fall more.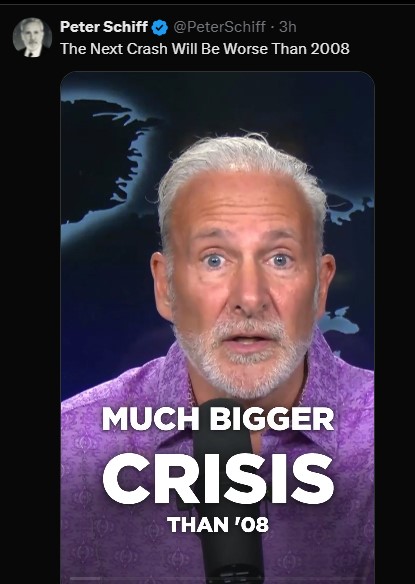
These are views, not facts. A chart pattern is not a promise.
BTC technical outlook: $60,000 in focus
On the daily chart, BTC sits near a rising trendline around $61,000 to $60,000. The 50-day EMA at $74,573 has crossed below the 200-day EMA at $75,411. That is a death cross.
On the weekly chart, price is below the 20, 50, 100 and 200 EMAs at $74,228, $77,245, $78,257 and $69,614. Weekly RSI is 35.81, while daily RSI is 20.39.
Bitcoin is about 29% below its recent $87,000 high. Oversold readings often lead to short bounces. A bounce is not a bottom.
Level
Price
Why it matters
Resistance 1
$64,000 - $66,000
Bulls need to reclaim this zone
Resistance 2
$74,573 - $75,411
Daily 50 and 200 EMA, death cross area
Support 1
$61,000 - $60,000
Rising trendline
Support 2
$58,000
Area near the July low
Support 3
$55,000
Next target if the trendline breaks
A daily close below the trendline could open the way toward $58,000 and then $55,000. A move above $66,000 would be the first sign that selling is fading.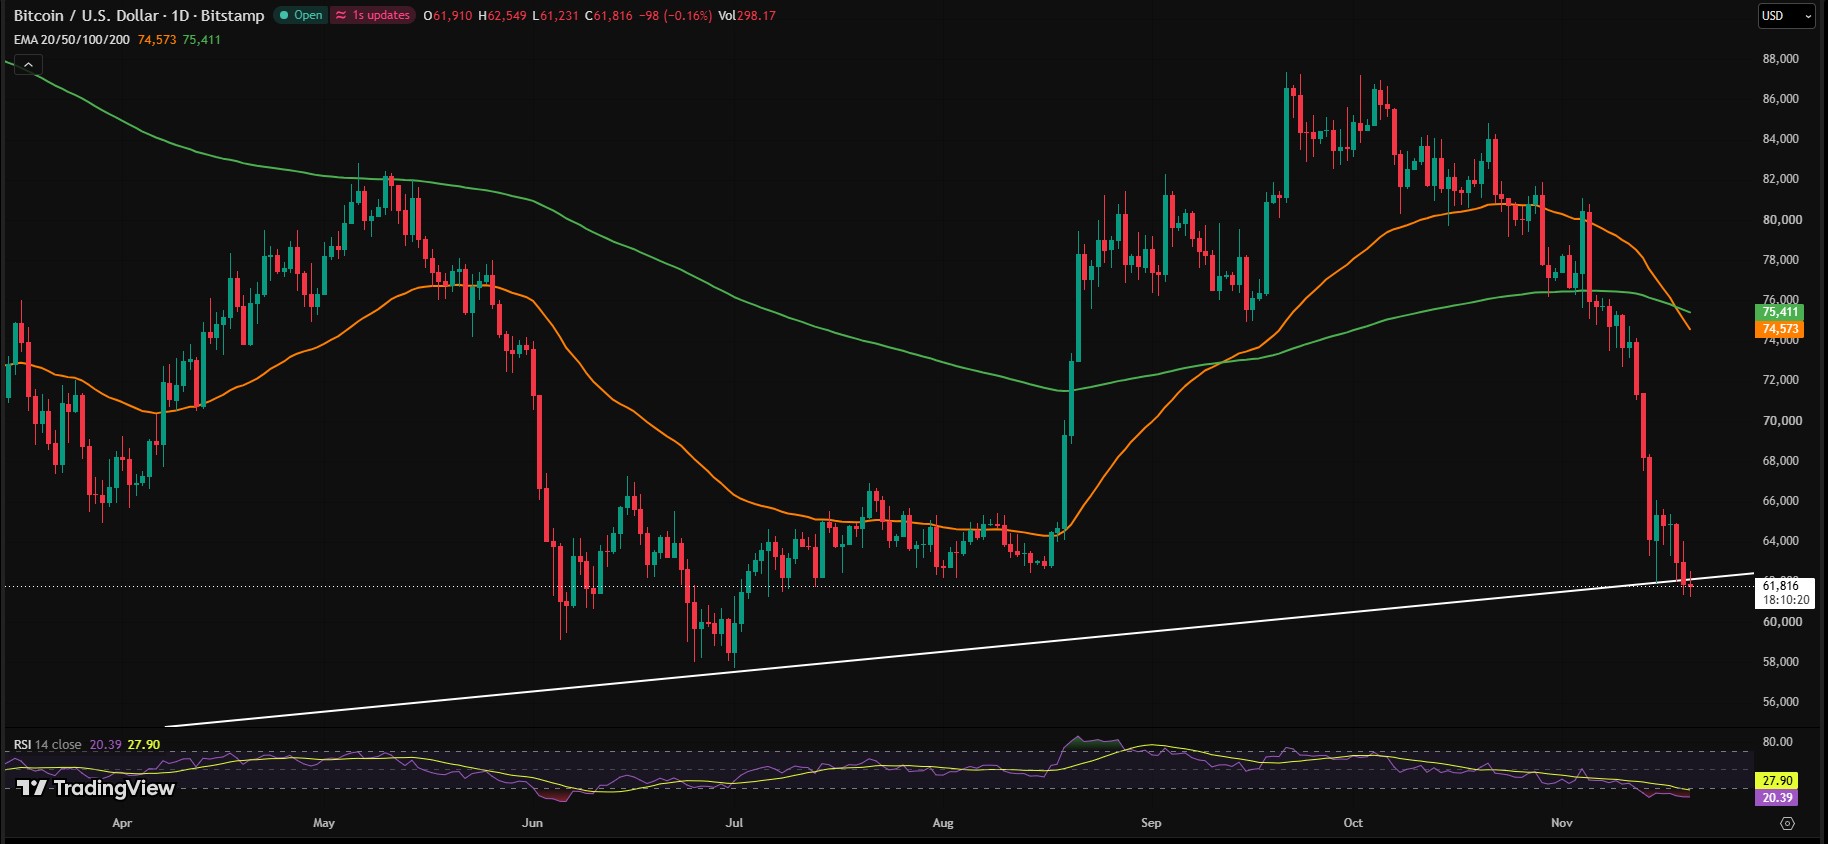
No one knows where this ends. Watch ETF flows and the Dec. 9 Fed decision for clues on Bitcoin's next move.
Disclaimer
This article is for information only and is not financial advice. Cryptocurrency trading carries a high risk, and prices can swing sharply. You can lose some or all of your money. Do your own research and speak with a licensed financial advisor before making any investment decision.
About the Author Lokesh Gupta
Research Analyst at coingabbar.com
Lokesh Gupta started his journey in financial markets 23 years ago and never looked back. From Forex to Comex, NSE, MCX, NCDEX, and now Crypto — he has seen it all. He holds an MBA in Finance and over the last 4 years, Bitcoin, Ethereum, Solana, XRP, and trending coins have become his main focus. People who follow his work say one thing — he keeps it real. No fancy language, no unnecessary complexity. Just honest market research that helps you understand what is happening and why it matters to your money.
 November 19, 2026
November 18, 2026
November 17, 2026
November 17, 2026
November 16, 2026
November 14, 2026
November 14, 2026
November 9, 2026
November 9, 2026
Frequently Asked Questions (FAQ)