Why is Crypto Crashing? Bitcoin (BTC) slipped below $58,000 as heavy liquidations dragged the crypto market lower.
At the time of writing, BTC trades near $57,900, down 6.20% in 24 hours and 13.40% over seven days. Ethereum (ETH) fell 6.40% to $1,638.45 and is down 13.5% on the week. XRP lost 6.7% to $0.8931, a weekly drop of 9.00%.
The global crypto market cap is $2.07 trillion, down 5.6% in 24 hours. Buyers are staying away even at lower prices. Here is why, and where the next levels sit.
Why Is the Crypto Market Down Today? Reason Behind the Bloodbath
Tech Rout Drags Crypto Lower as Nasdaq Sinks 5.3%
Stocks fell hard on Friday, November 20. The Dow Jones dropped 1.9% and slipped below 50,000. The S&P 500 fell 3.6%, and both closed in correction territory.
The Nasdaq Composite dropped nearly 5.3% and turned negative for the year. Chip stocks led an AI sell-off. Nvidia fell 14%, while AMD, Broadcom and Micron also had double-digit losses.
Crypto often moves with risk assets. This time it followed stocks lower.
Fed Hike Bets Climb to 88.6% for December 9
Rates are the second worry. CME data shows an 88.6% chance the Fed lifts rates from 3.75%-4.00% to 4.00%-4.25% at the December 9 meeting.
The odds of no change are 11.4%. A cut stands at 0%. A day ago, hike odds were 93.9%.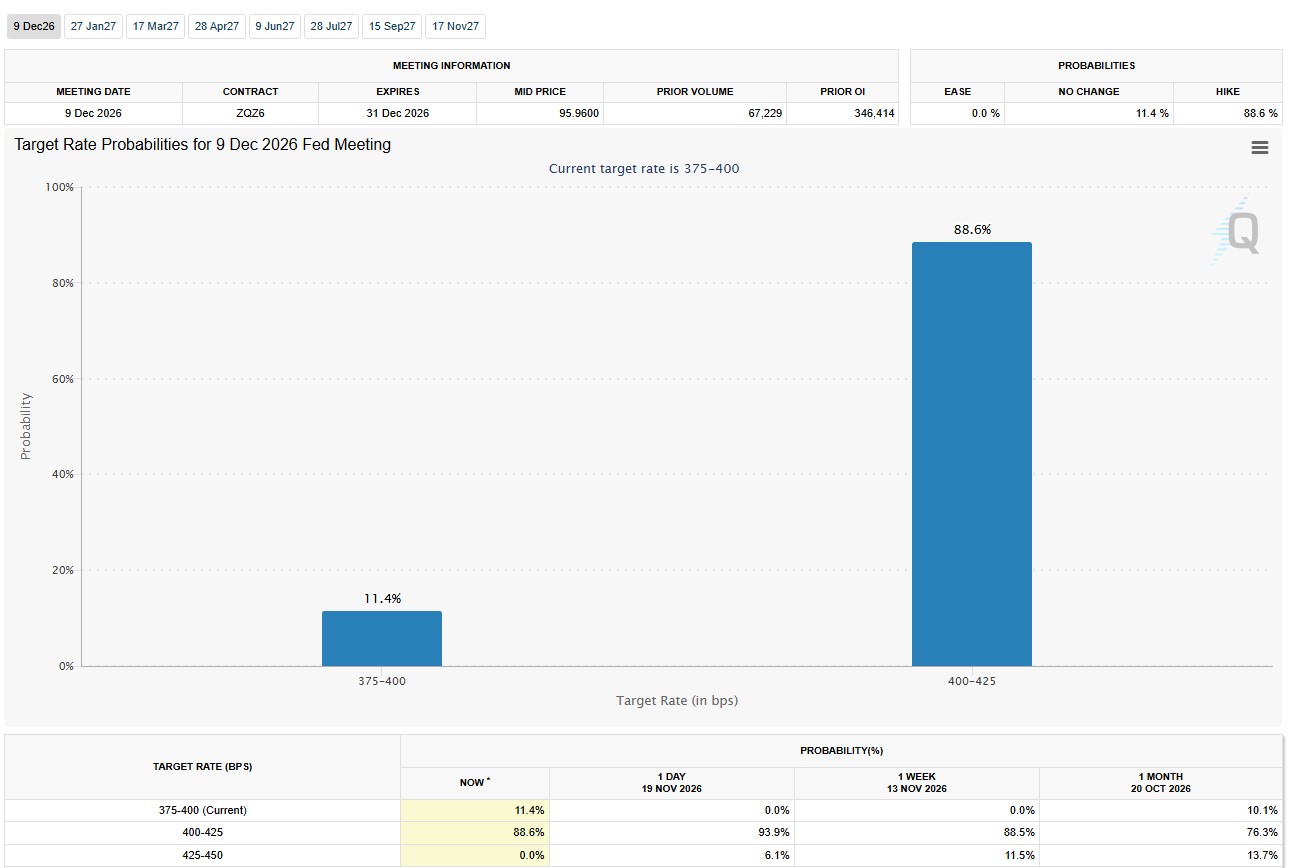
Bitcoin ETFs Bleed $4.44B in 30 Days as Demand Fades
SoSoValue data, as of November 20, shows money leaving Bitcoin and Ethereum spot ETFs.
Asset
1-Day Flow
30-Day Flow
Cumulative Flow
Net Assets
BTC
-$124.43M
-$4.44B
-$9.96B
$26.90B
ETH
-$13.18M
-$1.52B
-$2.91B
$2.83B
XRP
-$4.97M
-$22.89M
+$1.78B
$989.61M
XRP funds saw small outflows too, but their total flow is still positive.
$2.27B in Longs Wiped Out as 358,619 Traders Get Liquidated
CoinGlass shows long liquidations have led the market for most of November. Over 24 hours, total liquidations reached $2.55B.
Longs made up $2.27B, or 89.1%. Shorts were $277.51M, or 10.9%. Bitcoin led with $1.16B, and Ethereum followed with $583.78M.
About 358,619 traders were liquidated. The largest single order was a $51.71M BTCUSDT long on Binance.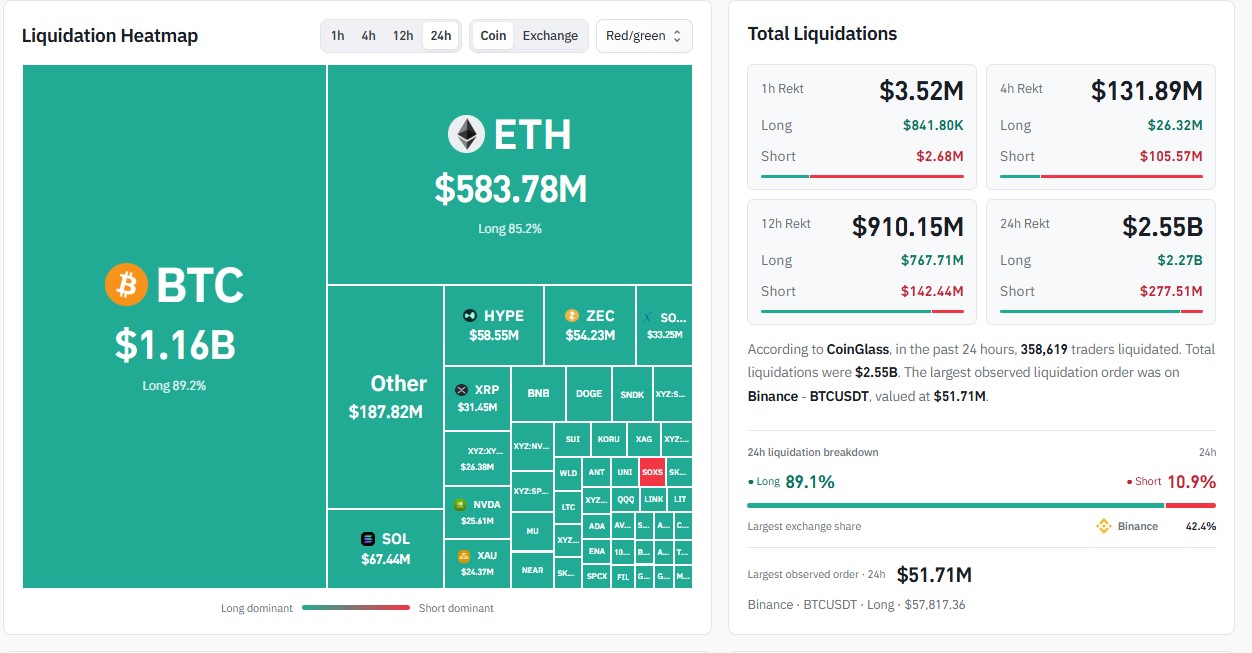
Fear Gauge Plunges to 12 From 68 a Month Ago
The index reads 12 on November 21, which means Extreme Fear. It was 12 yesterday and 13 last week.
One month ago, it stood at 68, which is Greed. That is a sharp drop in sentiment.
Why is Crypto Crashing and How Low Can Bitcoin, Ether and XRP Go?
Bitcoin Price Prediction: $52,000 in Sight if Trendline Breaks
If BTC closes the week below its trendline, sellers may aim for $52,000 to $55,000. A slide toward $48,000 to $50,000 would then be on the table.
Rising yields and a likely Fed hike could keep pressure on risk assets. Another weak day for tech stocks would not help.
Bulls need to reclaim $60,000 to $62,000. That could open a bounce toward $69,556 to $73,677. It would still be a relief move inside a larger downtrend, unless BTC also wins back the moving averages.
Ethereum Price Prediction: $1,500 Support Is the Line to Watch
ETH is already 67.1% below its all-time high of $4,953.7. The first test is the $1,500 area, close to the weekly low of $1,538.
A weekly close below it would put $1,364.72 in focus. Levels like $1,300 and $1,000 only come into play if that support breaks and fear spreads. A fall to $1,000 would be 38.6% from here. Nobody can promise that outcome.
On the upside, buyers must defend $1,500 first. Then $1,762 and $1,900 are the next marks. A rising trendline on the weekly chart also sits near today's price.
XRP Price Prediction: Bears Hold Control Below $0.985
The weekly chart shows lower highs and lower lows since the peak near $3.60. XRP has broken below the $0.985 support zone.
It also trades under the 20, 50, 100 and 200 EMAs, which sit near $1.24, $1.43, $1.53 and $1.36.
Analyst Ali Charts noted a break below the $0.99 lower edge of a channel. He is watching $0.80 and $0.64 as the next major supports.
Level
Type
What it means
$1.35 to $1.53
Resistance
Stronger EMA cluster
$1.10 to $1.24
Resistance
First recovery target
$0.985 to $1.00
Resistance
Broken support, key reclaim
$0.85
Support
Nearest downside level
$0.80
Support
Next major support
$0.75 to $0.70
Support
Deeper downside zone
$0.64
Support
Lower major support
If XRP fails to reclaim $0.98 to $1.00, a move toward $0.85 looks possible. Further slips toward $0.75 to $0.70 cannot be ruled out.
If buyers win back $0.985 and hold it, a bounce toward $1.10 to $1.24 could follow.
There is one small bullish note. The monthly Stochastic RSI showed similar fakeouts near oversold levels in 2020 and 2023. Strong rebounds came after both. That does not mean history will repeat.
Disclaimer
This article is for information only and is not financial advice. Cryptocurrency prices are volatile, and you can lose money. Do your own research and speak to a licensed financial advisor before you invest.
About the Author Lokesh Gupta
Research Analyst at coingabbar.com
Lokesh Gupta started his journey in financial markets 23 years ago and never looked back. From Forex to Comex, NSE, MCX, NCDEX, and now Crypto — he has seen it all. He holds an MBA in Finance and over the last 4 years, Bitcoin, Ethereum, Solana, XRP, and trending coins have become his main focus. People who follow his work say one thing — he keeps it real. No fancy language, no unnecessary complexity. Just honest market research that helps you understand what is happening and why it matters to your money.
 5 hours ago
November 20, 2026
November 19, 2026
November 18, 2026
November 17, 2026
November 17, 2026
November 16, 2026
November 14, 2026
November 14, 2026
Frequently Asked Questions (FAQ)