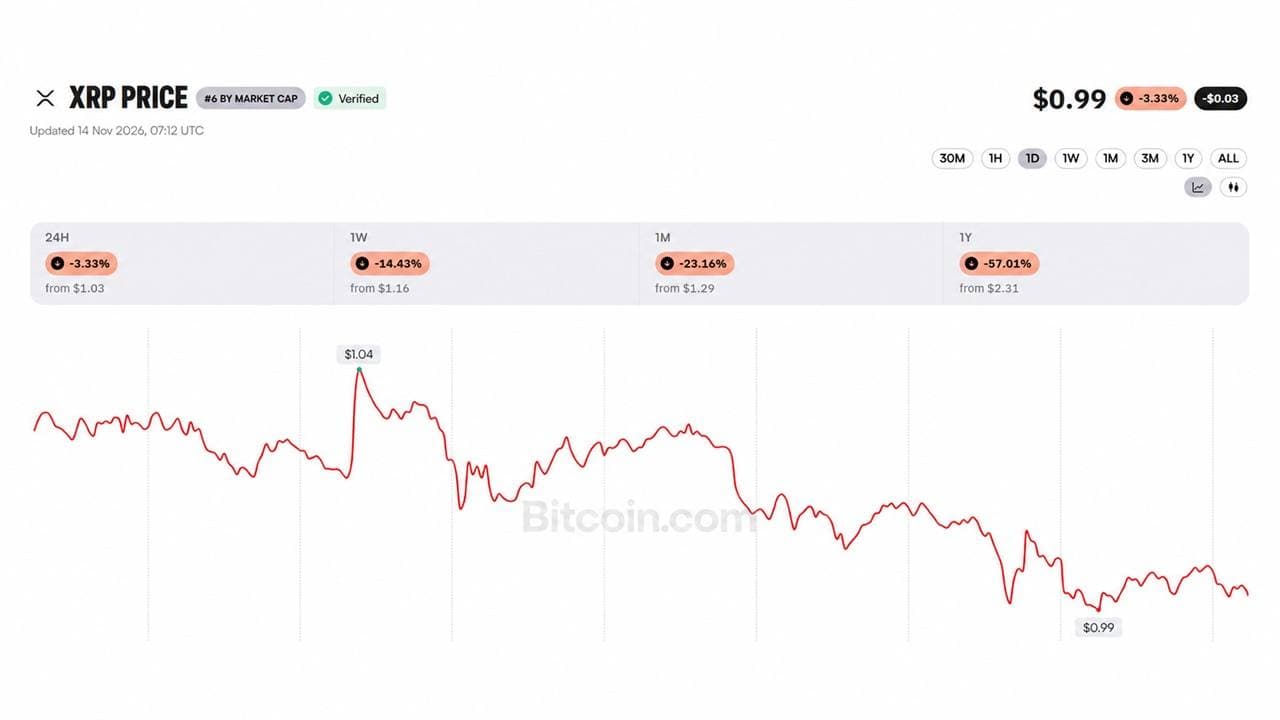
XRP is trading near $0.99, down 3.61% in the last 24 hours. The token touched a low of $0.9789 and a high of $1.043 during that time.
The weekly candle is down about 10.93%. Buyers have not stepped in yet.
Market cap sits at $62.86B. The all-time high of $3.842 is now 74.2% away.
Weekly chart still shows lower highs and lower lows
The structure remains bearish. XRP has made lower highs and lower lows since the peak near $3.60.
XRP Price is below the middle Bollinger Band at $1.2512. The lower band is at $0.8968, and the price is hovering just above it.
The weekly RSI reads 36.28. That is weak and close to oversold. Its moving average is at 48.09, so momentum still points down.
A short bounce can happen from here. But nothing on the chart says the trend has turned.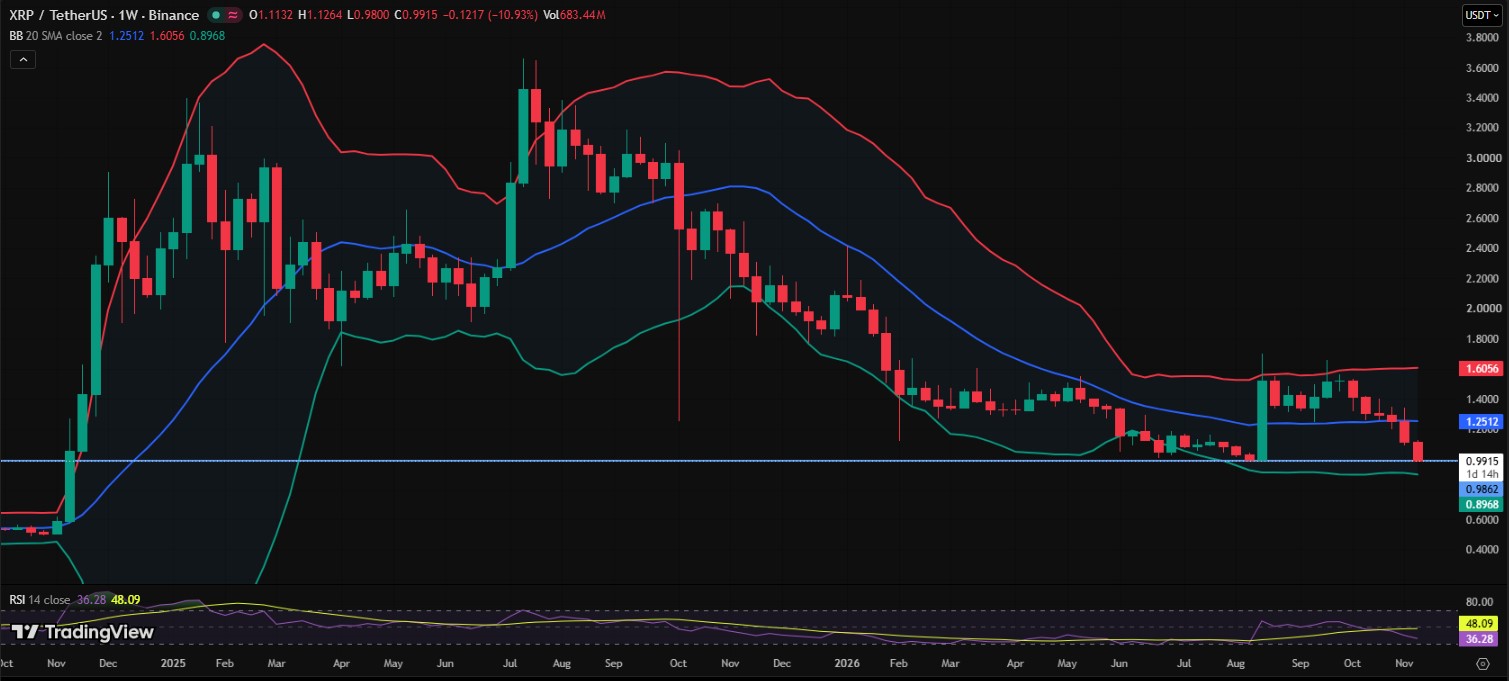
Derivatives traders lean to the downside
Coinglass data tells a similar story. Open interest fell 2.65% to $2.20B. Futures volume dropped 5.55% to $2.91B.
The funding rate is negative at -0.0050%, or about -5.4% annualized. That means shorts are paying longs a small fee. Binance perp basis is also negative at -0.050%.
Taker buy/sell ratios are below 1 on Binance (0.9035), OKX (0.8613), Bybit (0.8966), and Hyperliquid (0.9489). Gate is the only exchange above 1, at 1.0039.
Liquidations reached $14.15M in 24 hours. Around 91% were longs, worth $12.90M. Shorts lost only $1.24M.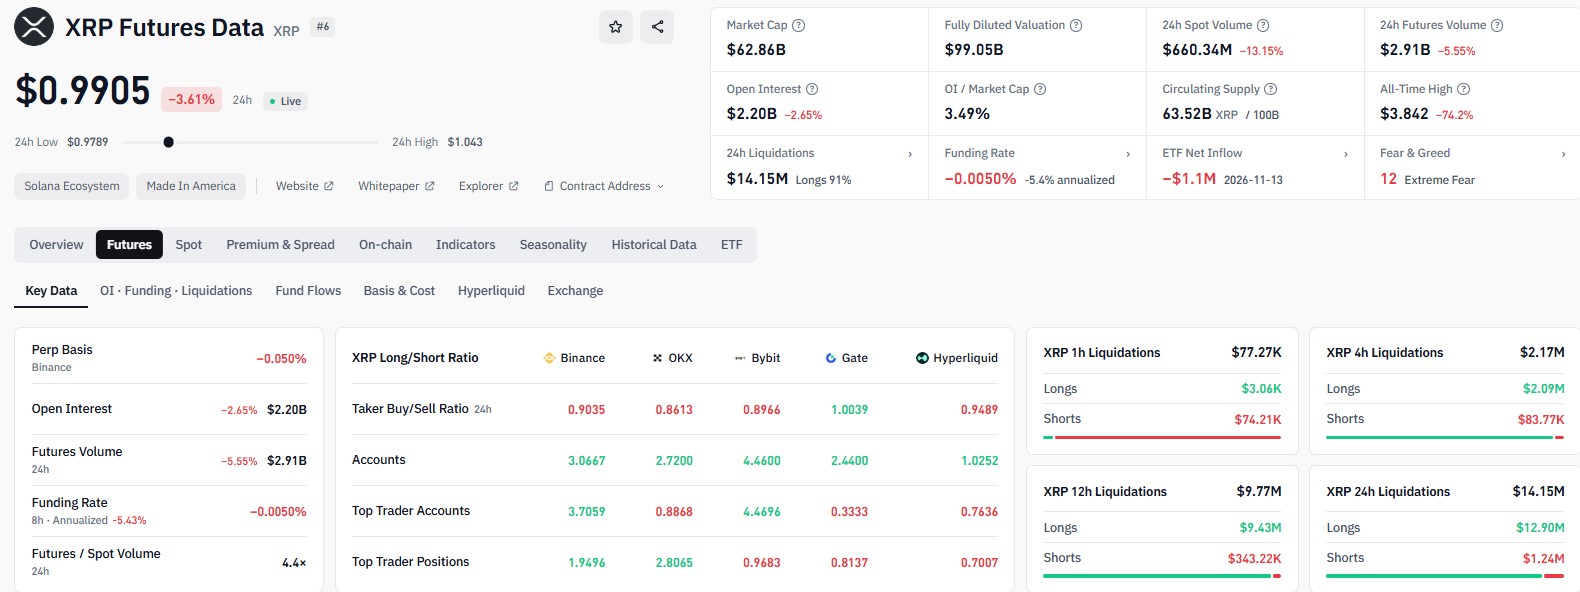
The Fear & Greed Index reads 13, which is Extreme Fear.
Spot ETFs see small outflows
SoSoValue data shows a daily net outflow of $1.09M as of Nov. 13. Cumulative net inflow is still $1.79B.
Total net assets stand at $1.15B, or 1.77% of the market cap. Total value traded was only $22.00M.
Sponsor
1D Net Inflow
Net Assets
Daily Change
Bitwise
$0
$416.89M
-1.04%
Franklin
+$4.45M
$322.56M
-1.47%
Canary
$0
$248.62M
-1.18%
21Shares
$0
$109.77M
-1.25%
Grayscale
-$5.54M
$53.81M
-1.35%
Franklin was the only fund with fresh money. Grayscale saw the biggest exit. The other three had no flows.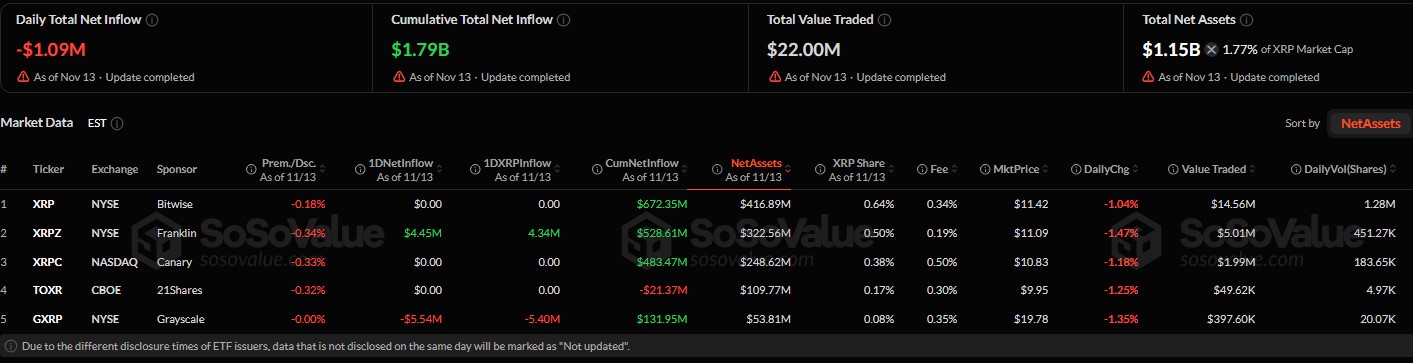
Key levels to watch
Level
What It Means
$0.8968
Lower Bollinger Band
$0.85 to $0.90
Downside zone if weekly support breaks
$0.95 to $0.98
Immediate support
$1.043
24-hour high
$1.10 to $1.15
First resistance to reclaim
$1.2512
Middle Bollinger Band
$1.40 to $1.60
Upside zone if the trend turns
XRP outlook: bears hold the edge for now
The $0.95 to $0.98 zone is the one to watch. A weekly close below it could open the way toward $0.85 to $0.90, near the lower Bollinger Band.
On the upside, buyers first need to reclaim $1.10 to $1.15. After that, a sustained move above $1.2512 would be the first real sign of a trend change. That could bring $1.40 to $1.60 into view, with the upper band at $1.6056.
Without a push above $1.25, more downside or a long sideways phase looks more likely than a fast recovery.
Extreme fear has marked local lows before, so a relief bounce is possible. Nobody can say how far it would go.
Disclaimer
This article is for information only and is not financial, investment, or trading advice. Cryptocurrency prices are highly volatile, and you can lose some or all of your capital. Price levels and forecasts are not guaranteed. Always do your own research and speak with a licensed financial advisor before making any investment decision.
About the Author Lokesh Gupta
Research Analyst at coingabbar.com
Lokesh Gupta started his journey in financial markets 23 years ago and never looked back. From Forex to Comex, NSE, MCX, NCDEX, and now Crypto — he has seen it all. He holds an MBA in Finance and over the last 4 years, Bitcoin, Ethereum, Solana, XRP, and trending coins have become his main focus. People who follow his work say one thing — he keeps it real. No fancy language, no unnecessary complexity. Just honest market research that helps you understand what is happening and why it matters to your money.
 15 minutes ago
2 hours ago
November 9, 2026
November 9, 2026
November 5, 2026
November 5, 2026
November 5, 2026
November 5, 2026
November 3, 2026
Frequently Asked Questions (FAQ)