XRP has fallen below $1 again, renewing comparisons with a brief dip in August that was followed by a sharp rally. But market conditions have changed: Bitcoin, which led the earlier rebound, is now declining, while heavier trading volume and weak technical indicators suggest the latest sell-off may be harder to reverse.
XRP was trading at about $0.96 after dropping 5.2% in 24 hours and 17.5% over the past week. It is down 47.9% since the start of the year and 73.7% from its all-time high of $3.65, reached on July 17, 2025. Its market capitalization has fallen to about $61 billion, although it remains the sixth-largest cryptocurrency.
The decline followed a test of the $1 level on November 13, when XRP briefly fell to $0.996 before closing at $1.01. The token has since moved below that threshold.
The last time XRP recorded a daily close below $1 was in August. It first fell beneath the level intraday on August 11, reaching $0.991 before closing at $1.02. Its first close below $1 came on August 14, at $0.999. Buyers briefly pushed it back above the mark, but XRP closed at $0.993 on August 16, the last daily close below $1 during that episode.
XRP traded below $1 at some point on each day from August 13 to August 19, but closed under the threshold on only two days: August 14 and August 16. Afterward, it rallied quickly. XRP rose to $1.11 on August 19, $1.27 on August 20 and $1.45 on August 21. It reached $1.70 during the day on August 22—about 71% above its August 16 close—as trading volume climbed to 558.8 million.
The rally continued in the weeks that followed, with XRP reaching a high of $1.57 by September 22. Those gains did not last. About 90 days after the August 16 close below $1, XRP was trading at $0.96, roughly 3.3% below that August closing price.
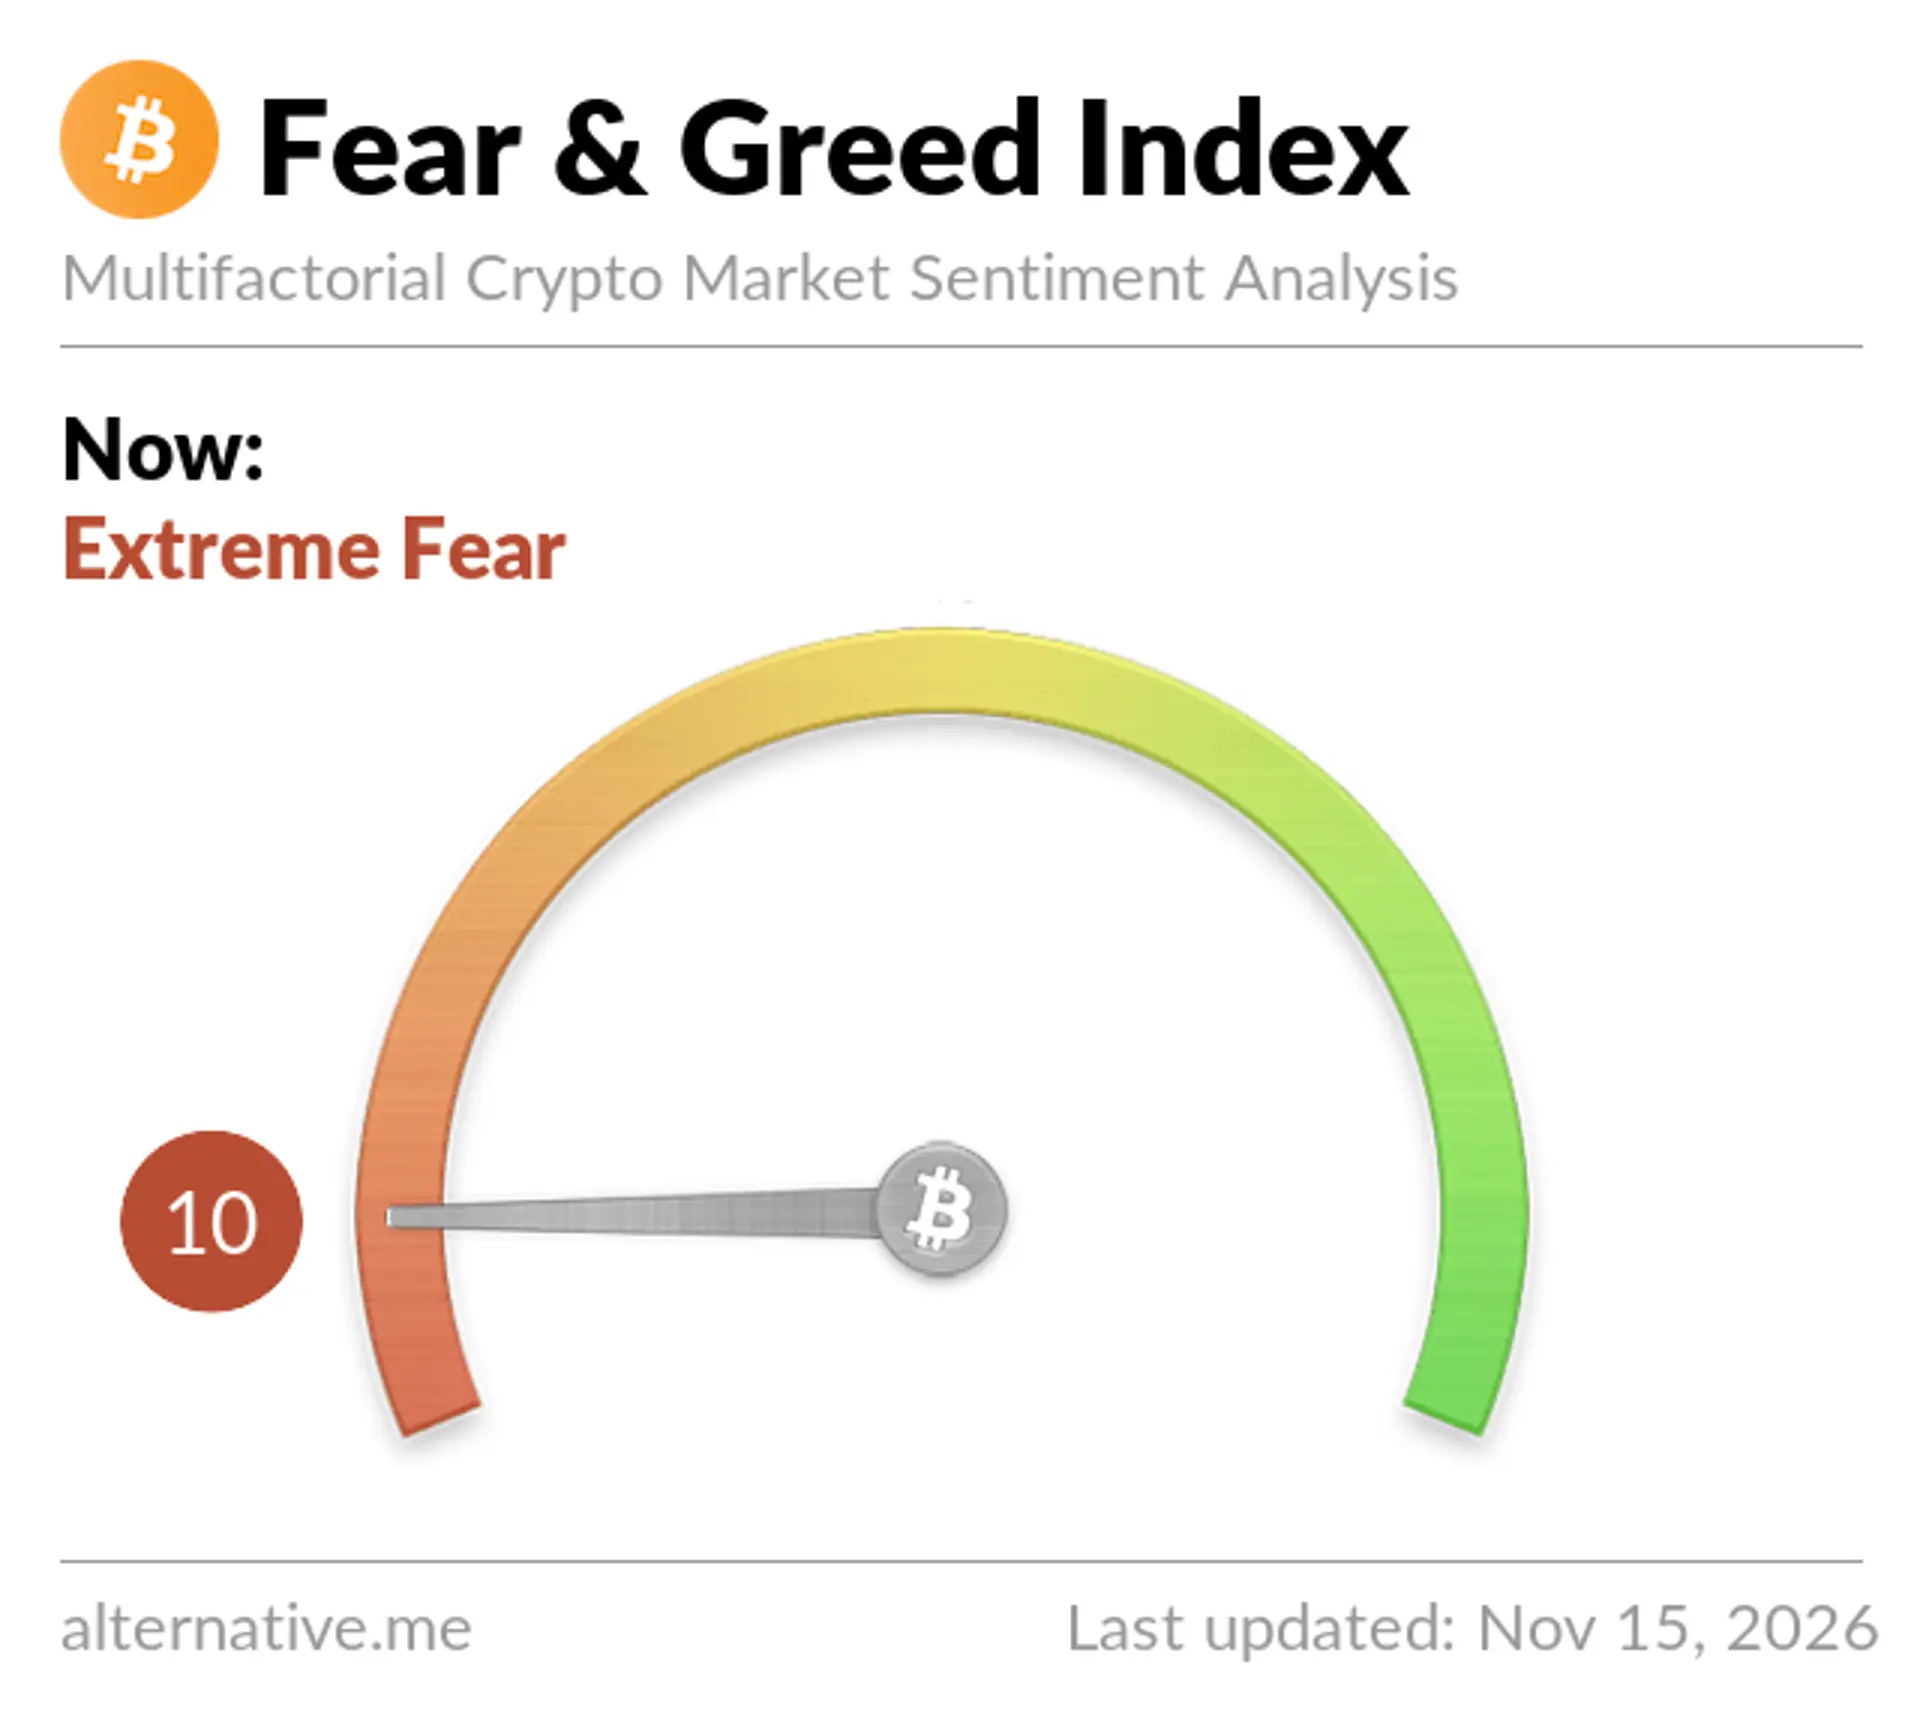
Bitcoin’s performance was an important difference between the two periods. During the August rebound, Bitcoin rose from $62,837 on August 16 to $75,584 by September 15, and later reached $82,131 on October 15. It is now trading around $65,378, down 16.9% over the past month. That decline may make it harder for XRP to attract the broad market momentum that supported its August recovery.
Trading activity also differs. XRP’s August 16 close below $1 came on volume of about 19.6 million. Its November 13 test of the level was accompanied by approximately 140.1 million in volume. High-volume declines can indicate stronger selling pressure, though volume alone does not determine what prices will do next.
XRP has also fallen below several commonly watched moving averages. Its 20-day average stands at about $1.20, its 50-day average at $1.33 and its 200-day average at $1.26. The token has dropped about 28% over the past 30 days, putting it beneath all three measures.
A recovery could still occur if Bitcoin stabilizes and selling pressure eases. In that scenario, XRP might reclaim $1, as it did shortly after its August closes below the threshold. If selling continues, traders may watch $0.90 and $0.80 as possible lower price levels. Those would represent declines of about 6.3% and 16.7%, respectively, from $0.96.
The August episode is a useful point of comparison, but it does not guarantee a repeat. Bitcoin’s rise helped lift XRP during that rebound, while its current decline presents a less supportive backdrop. XRP’s return to its former high of $3.65 may remain difficult unless broader market conditions, particularly Bitcoin’s trend, improve.