- Tags
- BTC
Summary
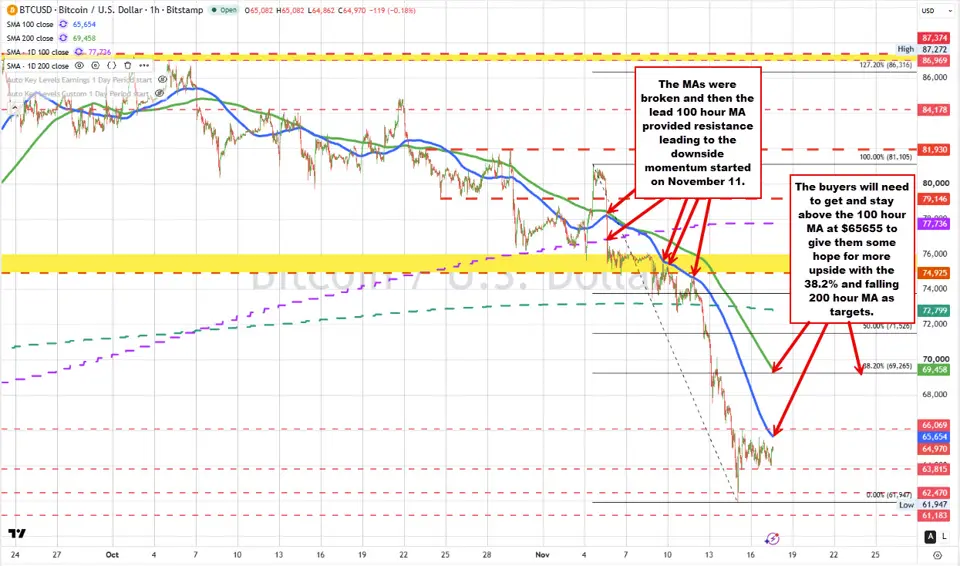
- Buyers would need to extend back above the falling 100 hour moving average near $65,655
Going back to November 5, Bitcoin fell below its 100 and 200 hour moving averages and its 100 day moving average—all on the same day. That series of breaks shifted control firmly toward the sellers.
The sellers then leaned against the falling 100 hour moving average on November 9 and again on November 11. Buyers could not get above that moving average, and the subsequent break below the 200 day moving average—currently at $72,799—gave sellers another go-ahead to push lower.
They did.
The decline finally reached a low of $61,947 on Sunday. The price rebounded to $66,069 later that day before settling into a consolidation, with support developing near $63,815.
The consolidation over the last two or so days has allowed the falling 100 hour moving average to catch up with the price. That moving average currently comes in at $65,654.
Today’s high reached $65,123, leaving the price $531 short of that technical barometer. However, with the moving average continuing to fall, decision time is getting closer for both buyers and sellers.
In the video, I outline why that moving average matters and the levels that would either keep sellers in control or give buyers an opportunity for a larger corrective move.
As long as the price remains below the 100 hour moving average, sellers retain control. Buyers have stabilized the price after the sharp decline, but they still need to show they can take back a technical level.
On the downside, the levels to watch are:
- $63,815: The consolidation floor. A break below would open the door for renewed selling.
- $61,947: Sunday’s low and the next downside target if that floor gives way.
Holding support can slow a decline. Getting above resistance is what starts to change the bias.
A move above the 100 hour moving average at $65,654—and the ability to stay above it—would give buyers their first meaningful technical improvement.
That would put the next upside targets in play:
- $66,069: Sunday’s corrective high.
- $69,265: The 38.2% retracement of the decline from the November high.
- $69,460: The falling 200 hour moving average.
The retracement and 200 hour moving average form a higher resistance area. However, buyers first need to get through the 100 hour moving average and Sunday’s corrective high before that area becomes a more immediate focus.
After a sharp trend move, a market can correct through price, through time, or through a combination of both.
Bitcoin’s recent sideways trading is allowing the falling 100 hour moving average to move closer to the market. That creates a clearer decision point without requiring a large rally.
For sellers, the moving average becomes a level to lean against and define risk. Stay below, and the bearish bias remains intact. Move above and hold above, and some of that control starts to shift toward the buyers.
For buyers, a bounce from the low is a start. Breaking and holding above a moving average that has repeatedly capped rallies is stronger evidence of progress.
For now, the sellers remain in control. The 100 hour moving average is the barometer for a change.
Be aware. Be prepared.
Your market education doesn't end here. Discover more insights and practical lessons in our investingLive video collection.
Must Read
- Nvida stock analysis before its earnings
- Oil price analysis: Sellers are losing momentum, but $86.75 remains the danger line
- Weekend - Bitcoin fell to four-month low near $62,000 as crypto liquidations top $2 billion
- Morgan Stanley’s Wilson: correction in final phase, three reasons oil can fall into 2027
- Deutsche Bank sees 3 straight Fed hikes after hot CPI, adding a January move
- 5 forced sellers that can turn a market dip into a rout, and how to spot them
- Google TPUs could gain share from Nvidia turmoil, Bloomberg Intelligence says, eyeing $50B
- Natural gas analysis with the "perfect" trading range
- Fed’s Warsh doesn’t talk about monetary policy in a speech on AI
- Goldman’s second gold forecast downgrade in a month turns its bear case into the base case
- Anthropic IPO oversubscribed several times ahead of record $90 billion listing
- Trump says he wouldn’t mind seeing Huang reinstated as Nvidia CEO
- Earnings week ahead: Nvidia without Jensen, Anthropic’s IPO, and the consumer meets a hiking Fed
- S&P 500 analysis before Nvidia's earnings tonight
- Ethereum's bearish trend could extend further without a dovish Fed pivot or a US-Iran breakthrough
- Gold futures rose Friday, but the rally failed. What I’m watching next week
- Morgan Stanley goes max overweight global stocks, sees 15% S&P 500 upside on AI capex
- Morgan Stanley bets on gold at $5,250, the boldest bank call with bullion near $3,875
- More from Morgan Stanley: 8,700 S&P target and $5,250 gold lead its 2027 outlook
- Nvidia earnings could test a fragile market. Five stocks are already offering clues
- Riddle: Buyers were more aggressive, yet stock prices fell. How is that possible?
Best in 2026
Sponsored