The Crypto Desk desk. Editor: Sam Daodu.
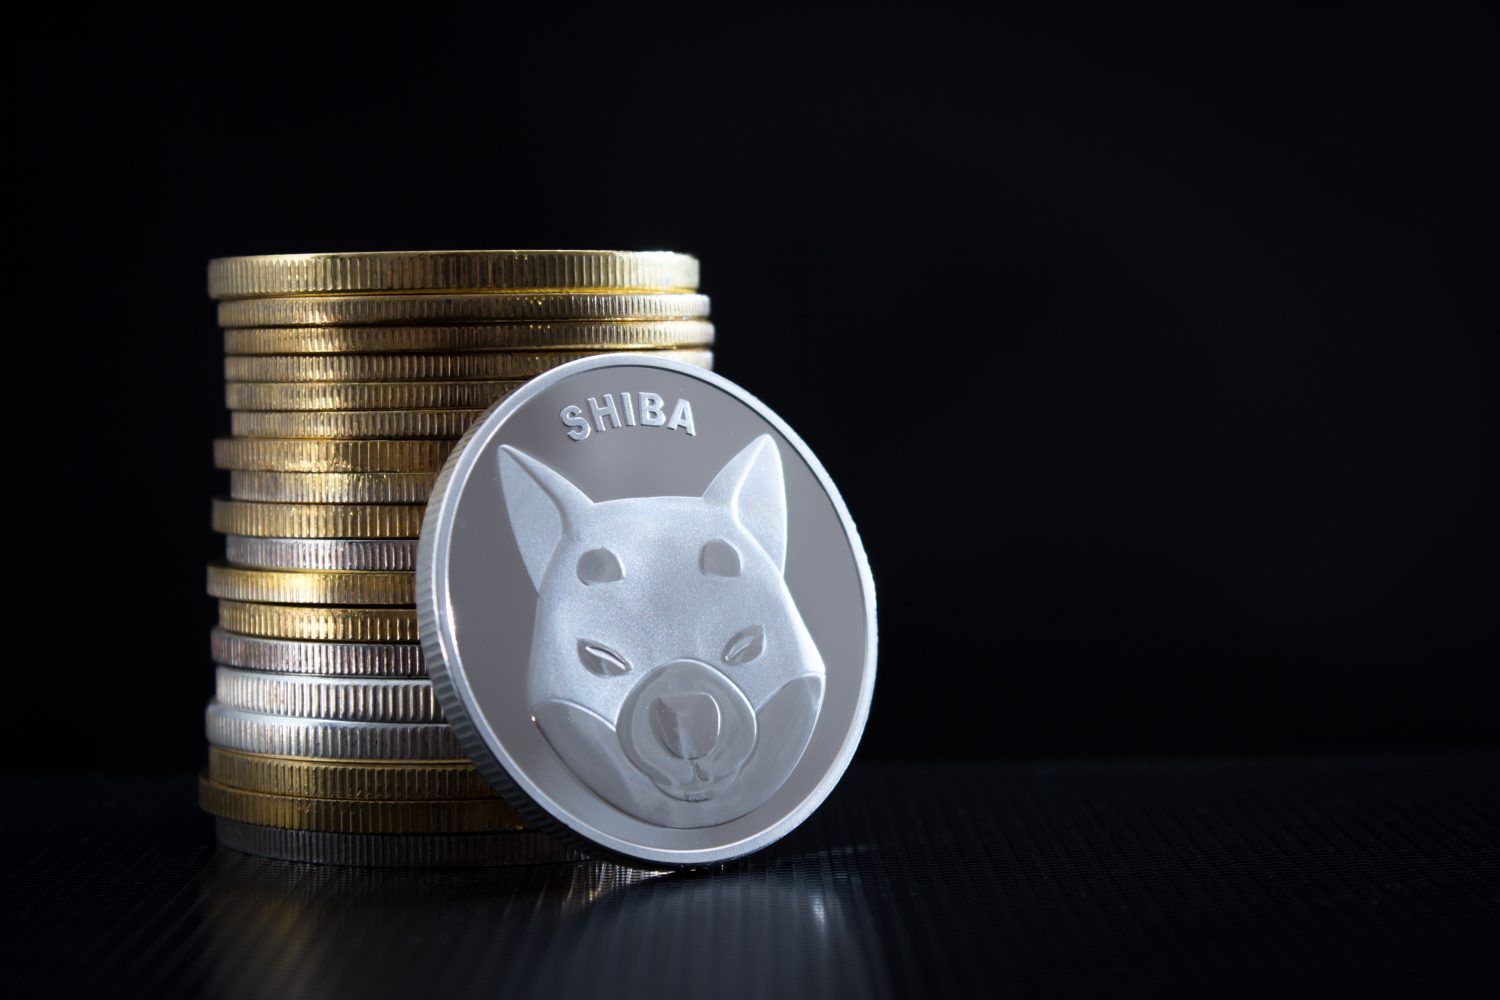
Shiba Inu (CRYPTO:SHIB) has broken through a key support level that held through the summer. SHIB is trading at $0.00000397, below its lowest daily close of the past year, $0.00000411, set on July 16. So how low could Shiba Inu fall before the end of the year?
Investors who saw SHIB bounce off the July support now face a tougher reality, since the coin is trading at prices it hasn’t closed at since October 2025.
Shiba Inu Is Down 22.5% in 30 Days and 95% Below Its All-Time High

Shiba Inu has experienced a sharp selloff that continues to accelerate. The coin trades 95% below its all-time high of $0.00008616 from October 2021, and it is down 8% in 24 hours, 11.5% over seven days, 15.1% over 14 days, and 22.5% over 30 days.
On November 13, SHIB closed at $0.00000425, 7% above its price, so the break below the July floor came in a single session.
SHIB’s market value has shrunk to about $2.34 billion, ranking 38th among cryptocurrencies. Overall, the coin is down 42.6% year to date and 55.8% over the past year. For those considering a long-term view, a look at what 100 million Shiba Inu could be worth by 2028 may offer some insight.
Shiba Inu’s Old Support Levels Have Turned Into Resistance

A support level is a price where buyers have stepped in before and stopped a fall. However, with SHIB slipping below several key support levels from the past year, those levels now act as resistance, where selling pressure may arise.
- $0.00000411 to $0.00000418 (4% to 5% above). The July support level, where buyers stepped in from July 13 to July 24.
- $0.00000425 (7% above). The closing price on November 13 was the weakest close in the previous 90 days before the drop.
- $0.00000436 to $0.00000446 (10% to 12% above). A cluster of closes from November 8 to November 12, which now poses challenges for recovery.
- $0.00000441 (11% above). The August base price, which marked a stable point on August 18 before SHIB climbed to $0.00000590.
- $0.00000590 to $0.00000610 (49% to 54% above). The peaks were reached during this year’s rallies in August and September.
Once a price breaks below a support level, it can often struggle to regain that ground, as earlier buyers may sell to recover their investments. Hence, the $0.00000411 to $0.00000418 range becomes the first significant barrier for any bounce.
Below $0.00000397, the past year’s chart has no tested floor to support the price, since every daily close since October 10, 2025, came in above it, which further complicates any recovery.
Shiba Inu Has Fallen Harder Than Bitcoin but Less Than Dogecoin
Shiba Inu has swung more dramatically than Bitcoin (CRYPTO: BTC) but not quite as sharply as Dogecoin (CRYPTO: DOGE) over most of the selloff. The table compares the three across different periods.
From 30 days to one year, SHIB lost more than Bitcoin but less than Dogecoin, and its losses this year run about twice Bitcoin’s. The past week broke that pattern, as Bitcoin’s 13% drop topped SHIB’s 11.5%. The situation hasn’t improved for either meme coin since an October look at whether meme coins are dead, and both have continued to decline.
To stabilize, Shiba Inu needs Bitcoin to halt its downward trend. Bitcoin is trading at $65,906, down 13% over the last week. Since SHIB often mirrors Bitcoin’s movements with more force, ongoing weakness in BTC could lead to an even sharper drop in SHIB’s price.
How Low Could Shiba Inu Fall Before Year-End?
Shiba Inu seems more likely to end the year below $0.00000411 than above it, and the $0.00000397 level could also face pressure. With no tested support beneath it, a daily close below this price—especially if Bitcoin’s decline continues—could push SHIB further into prices it hasn’t closed at since October 2025, making the hope of reaching $0.01 by 2030 even more distant.
A potential turnaround may come with a daily close above $0.00000411, 4% above its price, followed by a close above the November 13 level of $0.00000425, 7% above. SHIB has shown it can recover quickly when buyers return, as in July, when it jumped 27% from $0.00000418 to $0.00000531 in two days. If SHIB can climb back above the $0.00000436 to $0.00000446 range seen in November, selling pressure may begin to ease.
Contact [email protected] for any questions or corrections.
Sam Daodu is a crypto analyst and the editor of 24/7 Wall St.'s Crypto Desk, where he covers Bitcoin, XRP, Ethereum, Solana and the altcoins investors search for most. His work focuses on price levels, spot ETF flows, on-chain data and the regulatory decisions that move crypto markets, written so a first-time buyer and a seasoned trader can both use it.
Sam has written about crypto professionally since 2019 and has published more than 2,000 articles. Before joining 24/7 Wall St., he wrote for crypto media outlets and Web3 companies and ghostwrote for crypto founders and token launches. His analysis is syndicated on Yahoo Finance, MSN and AOL and has been cited by other crypto news sites. He also founded MacLabs Marketing, a content and personal branding agency for crypto founders and executives.
When he isn't reading charts, Sam is usually at the gym or watching One Piece, a series he maintains has better tokenomics than most altcoins.