XRP is clinging to a two-year low near $0.90 after a rejection at $1.35 earlier in November, and three large language models asked to map the downside broadly agree on where the first test lies.
According to CoinPaprika data cited in the report, the token changed hands at $0.9556 as of 08:22 UTC on Nov. 16, down 1.5% over 24 hours and 12.7% over the past week. It has yet to reclaim the $1.00 level that traders watch as a psychological threshold.
The exercise, reported by Cryptopotato, put the same question to ChatGPT, Grok and Gemini: what happens to XRP if it fails to retake $1.00 soon? All three identified $0.90 to $0.95 as the first support band. From there, the forecasts fan out.
ChatGPT took the most bearish central view. It called a moderate correction to $0.85 to $0.95 the most likely outcome and named $0.80 to $0.85 as the next major target if selling pressure persists. A slide below $0.70 was described as an extreme capitulation case with slim odds.
The model attributed the weakness to more than the token's own chart, pointing to Bitcoin's decline, a lack of institutional demand visible in recent ETF outflows, and an XRP price series printing lower lows. It also noted that XRP had already fallen far from October highs near $1.60.
Gemini matched the $0.85 call but widened the range. It sketched a tail-risk scenario in which Bitcoin breaks its own major support levels and XRP ETF outflows accelerate, dragging the token to multi-year lows of $0.50 to $0.60. XRP has not traded in that zone for more than two years, since before the late-2024 US presidential election. A move there would erase roughly 24 months of gains and undercut the bull-market case, a point the model conceded made the outcome very unlikely.
Grok aligned with the other two on the first support band but did not add a separate downside target in the summary of its response.
Note: Ranges reflect the models' published responses as summarized in the report.
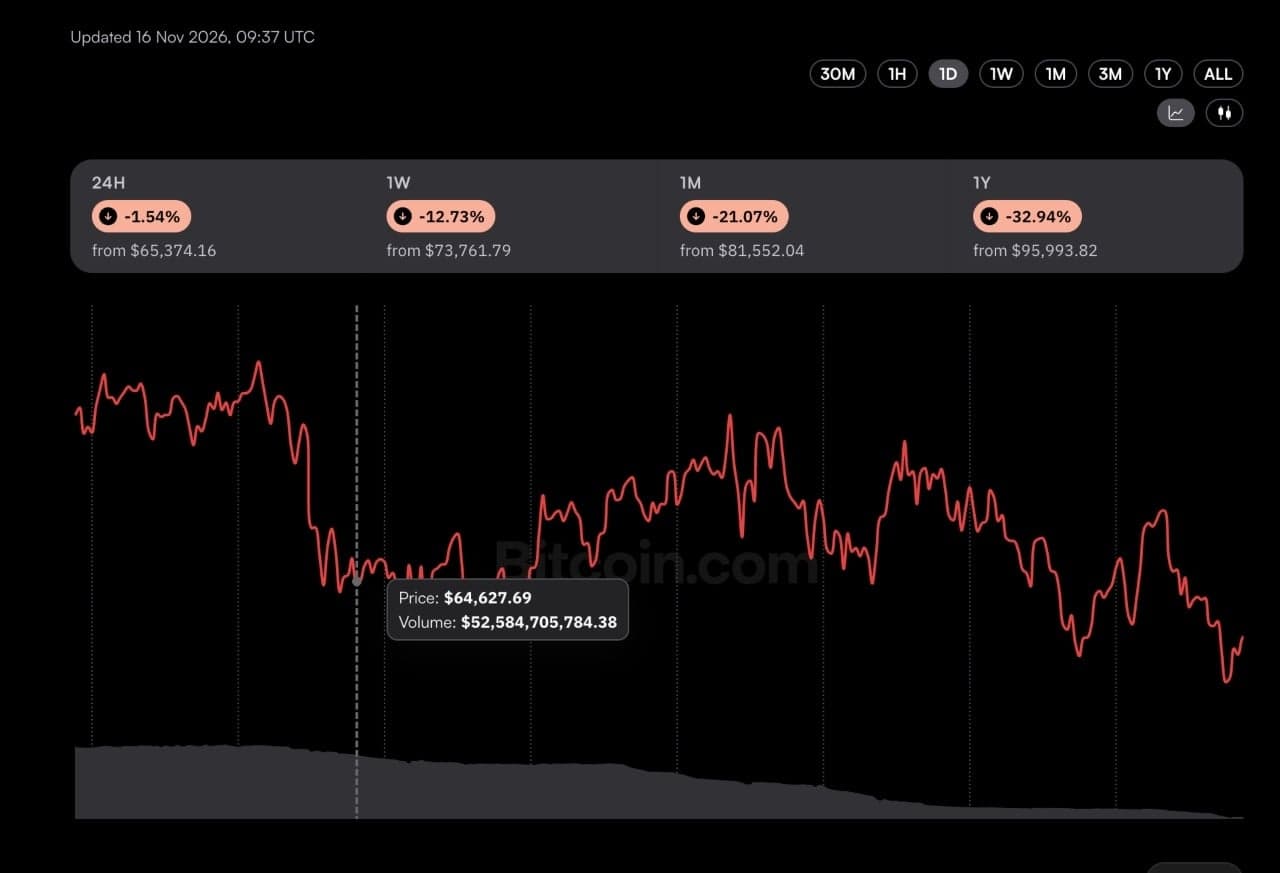
The backdrop is a market-wide drawdown rather than an XRP-specific event. Bitcoin traded at $64,703, down 1.8% on the day and 13.0% over the week, while Ethereum stood at $1,811, down 1.5% and 14.4% over the same periods, according to the same price data. That correlation is why the models kept returning to Bitcoin's chart and ETF flows as the variables that matter most.
For holders, the practical question is whether $0.90 holds on a closing basis rather than whether any single forecast proves correct. The models treat a decisive break of that level as the gateway to the $0.80 to $0.85 zone, with Bitcoin's own support levels and the pace of fund outflows the two inputs the projections hinge on.
The forecasts themselves are language-model outputs built on chart structure and market commentary, not investment research, and none of the figures represents a guaranteed outcome.
Once added, BigGo Finance appears first in Google Search Top Stories, so you get the broadest, most up-to-the-minute, and most comprehensive global financial news first.