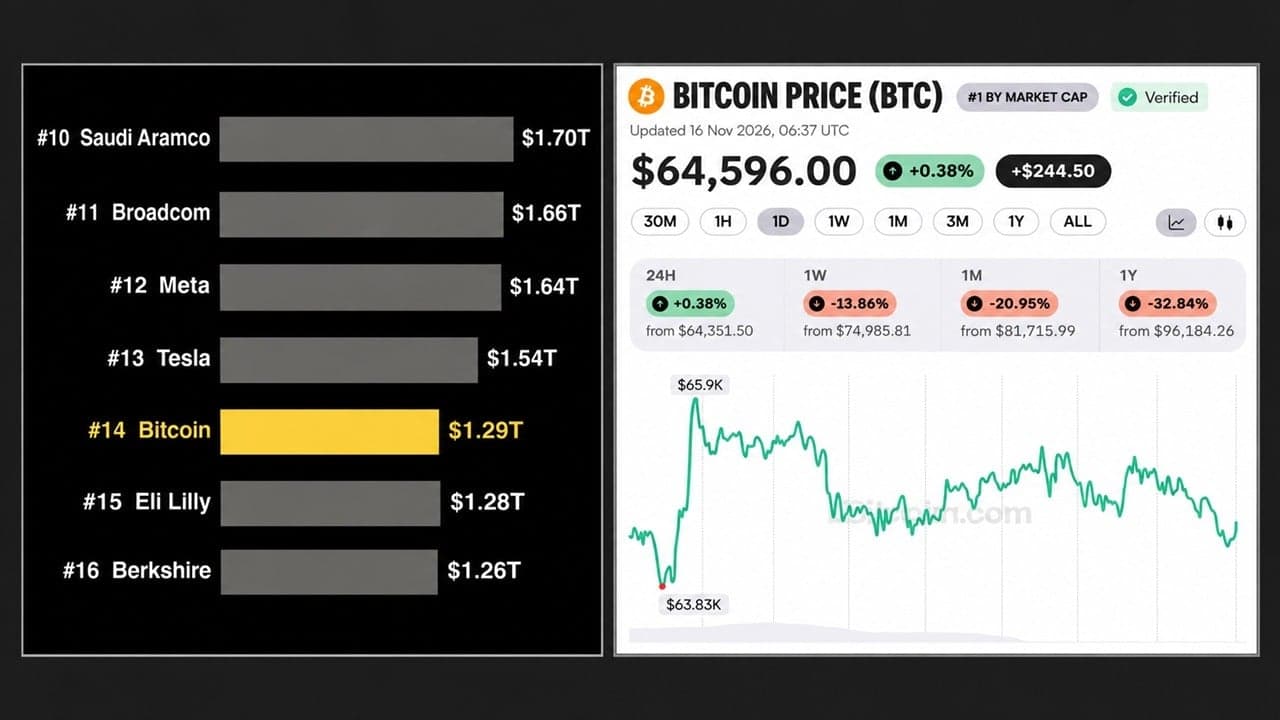
Caution is warranted for traders. Six consecutive weekly declines have left BTC oversold, increasing the scope for a short-term relief rally. Yet persistent selling by large holders and bearish trend signals keep the Crypto King’s recovery in doubt.
$1.07 billion in ETF outflows extends billion-dollar withdrawals
Last week’s net withdrawals from BTC spot ETFs reached $1.07 billion, according to SoSoValue, after $1.28 billion left the funds the week before. Institutional appetite for Bitcoin weakened, with outflows continuing for a third consecutive week and signalling softer investor demand. Should withdrawals persist and accelerate through this week, BTC could face further pressure and a deeper price correction.
Bitcoin recovery in doubt amid oversold conditions and whale selling
Almost every leveraged position established since the August rally was wiped out in the weekend sell-off, according to a 10x Research report. Market breadth, sentiment and momentum indicators consequently fell to some of their weakest readings in years.
Such stretched conditions raise the prospect of a near-term relief rally, the report explained. A durable recovery is less certain: large holders are still selling, while trend-following models have not yet indicated a reversal.
The analyst added: “Taken together, the pieces fit. This is not the time to buy, and it is not the time to give up either. It’s time to plan, set the levels where we would buy, and get ready for the next move,”
24%-plus decline: Bitcoin sellers gain control despite stretched downside
Six consecutive weekly losses have reduced the Crypto King’s value by over 24% since its correction began in early October. Last week’s close was below both the key 200-week simple moving average (SMA) at $68,194 and the 78.6% Fibonacci retracement at $65,616. That retracement is drawn from the August 2024 low of $49,000 to the October 2025 record high of $126,199. Losses have continued into this week, with BTC trading around $64,964 on Monday.
A continuation of BTC’s correction could point to a deeper decline towards $60,000, a key psychological level.
At 38, the weekly Relative Strength Index (RSI) remains below the neutral threshold of 50, indicating strong bearish momentum. The Moving Average Convergence Divergence (MACD) histogram’s bearish crossover from last week also remains in place, reinforcing the bearish outlook.
Conversely, a recovery in BTC could carry prices towards the 200-week SMA at $68,194.
A firmly bearish near-term bias persists on the daily chart as the Crypto King retreats further below key exponential moving averages (EMAs). Prices face a cap around the 200-day EMA at $75,946. Above it, the 100-day EMA at $76,470 and the 50-day EMA at $76,701 strengthen a concentrated overhead supply zone.
Near 23, the daily RSI is oversold and points to stretched downside momentum. Nevertheless, the deeply negative MACD shows that selling pressure remains dominant, even with the possibility of a short-term rebound.
Any upward move would first encounter resistance near $75,946 at the 200-day EMA. The next hurdles are the 100-day EMA at $76,470 and the 50-day EMA at $76,701. Together, these averages create a broad resistance zone before the horizontal barrier at $85,000.
With no nearby structural demand levels visible on the downside of the price chart, traders are likely to look to momentum signals. The oversold RSI and weak MACD indicate that the broader trend remains under pressure. To improve the technical outlook, any recovery would first have to challenge the overhead cluster of EMAs.
(The technical analysis of this story was written with the help of an AI tool. Know more.)
Bitcoin, altcoins and stablecoins: key questions
How is Bitcoin defined?
Designed to function as money, Bitcoin is a virtual currency and the largest cryptocurrency by market capitalisation. No single person, group or entity can control this payment method, removing the need for third parties to participate in financial transactions.
Which cryptocurrencies count as altcoins?
The term altcoin covers any cryptocurrency other than Bitcoin. Some also exclude Ethereum, however, because forks originate from these two cryptocurrencies. Under that definition, Litecoin is the first altcoin: it was forked from the Bitcoin protocol and is therefore an “improved” version of it.
How do stablecoins work?
Backed by reserves of the assets they represent, stablecoins are cryptocurrencies intended to maintain a stable price. Each stablecoin achieves this by pegging its value to a commodity or financial instrument, such as the US Dollar (USD), while an algorithm or demand regulates its supply. Their primary purpose is to offer an entry and exit route for investors seeking to trade and invest in cryptocurrencies. Stablecoins also provide a way to store value, as cryptocurrencies are generally subject to volatility.
What does Bitcoin Dominance measure?
Measured as Bitcoin’s market capitalisation divided by the combined market capitalisation of all cryptocurrencies, Bitcoin dominance offers a clear view of investor interest in Bitcoin. BTC dominance is typically high before and during a bull run, when investors favour relatively stable cryptocurrencies with large market capitalisations, such as Bitcoin. Falling BTC dominance generally signals that investors are shifting capital and/or profits into altcoins in pursuit of higher returns. This usually sparks a surge in altcoin rallies.